Leverage with Derivatives Trading Using 5 Mins Chart - Steemit Crypto Academy S6W1 - Homework Post for Professor @reddileep
Hello everyone. This is @sherazsultan. I welcome you all in the first week of 6th season where professor @reddileep has taught us about "Leverage Trading of Derivatives using the 5 minutes chart". This is my homework task.
.png)
Understanding Leverage Trading
A lot of trading method has been use in the crypto world. The traders use them to earn more profit. Now the trading has been made simple for the traders easiness. Now the traders are able to perform high number of trading with even low capital. The traders can perform unlimited trading no matter how much your capital is. The traders can even trade the assets more than their own capital in their account. They can purchase the coins 5-10x more than the their own capital.
This is the ability to perform trading ten time more high than the capital they have in their account by borrowing the assets from the broker or the exchange platform.
The Leverage trading is also a type of the trading in the crypto market which enable the traders to participate in more trading activities regardless of their account size. This type of the trading maximize the buying power of the traders. The traders can buy more coins with even little capital.
Here the traders can buy the assets by borrowing the coin from the brokers or from the platform. The traders then can participate in more trading activities by borrowing the coins and if their prediction goes well, they can even earn high reward. But this is equally risky too. If the prediction goes wrong, you may lose all your invested money.
That's why the leverage trading is not consider good for the new comers. Only experienced and the expert traders who have proper knowledge about the technical analysis should invest their money in the leverage trading because in case of lose, the traders need to deposit enough assets to overcome the lose.
This is for those investors who know how to manage the risk efficiently and analyze the market more accurately. If the trader manage the risk efficiently, they can earn good profit from the leverage trading.
Benefits of Leveraged Trading
The leverage trading increase the purchasing power of the traders. The traders can perform trade ten time more high than their own capital. The leverage trading enable the traders to participate in trading 100x more than their account size. This mean that if a trader have just 1$ in his account, he even can perform trade of 100 $ because of the leverage trading.
We are allowed to borrow high amount of money on the base of our initial capital.
This is more beneficial for the scalpers. The scalper traders can earn high reward with little price movement in leverage trading.
This is also a good way to earn high reward within short time period.
The cross margin facility is provide in leverage which help to safe from risk of liquidation. The cross margin allow investors to add more funds in their position when the price move in opposite direction.
In case of making profit or losing money, the traders can the traders can manage their position in the leverage trading. Instead of closing the whole position, the traders are allowed to end their trade in partials. In this way, they can manage their trade position in case of profit or lose.
The scalp trading is the leverage trading which allow the traders to make profit and exit from market as soon as possible.
The traders can earn the high profit with small capital because of the leverage trading. The crypto market is big source of income and traders can earn high reward. But because of having low capital, they sometime cannot open big trades. The leverage trading enable them to borrow funds and to open the huge trades. If market go in heir favor, they can earn high reward.
The assets are borrowed with low interest rate.
The traders can manage their portfolio by investing their money in more than 1 asset. They can invest in multiple coins and can earn more benefit.
Disadvantages of Leveraged Trading
The Leverage trading is highly risky.
If market goes in opposite direction, the traders may lose all his money.
If the traders are not capable to deposit enough money to cover up the loss amount, their accounts are at the risk of being liquidation.
The fee of the leverage trading is very high.
A high amount is charged in leverage trading for holding the trades. The longer you hold your trades, the more charges you will have yo pay.
To earn the profit from the leverage trading, the trader need to have the high trading skills. The traders should be very experts and professional to earn the profit from the leverage trading. The beginners cannot earn the profit from leverage. They may lose their all money because of having no proper knowledge about it. The proper knowledge about the risk management and the technical analysis is require to earn high reward from leverage trading.
Basic Indicators for Leveraged Trading
Leverage trading is very risky and traders can lose al their money if market start moving in unexpected direction. The risk factor get enhanced in the markets where the volatility is high. A lot of things should keep into consideration before investing money in leverage trading. The identification of trend is the most important thing. The traders should have proper knowledge about the market trend and then should take any trading decision. A lot of the indicators are there which are useful to identify the trend like RSI, Parabolic SAR, EMA, MACD, etc.
Parabolic SAR
The parabolic SAR is well known and popular indicator which is being use in the crypto world for identification of the trend. This indicator is use when the market move in particular direction. In trending market, the parabolic SAR work well to identify the market direction. It also beneficial to identify the trend reversal points.
Moreover, this indicator also helpful to get the best entry and exit spots. These spots can be use to decide what should do next in the market.
This indicator is represented in form of the dots which move with the movement of price. These dots move above the price level on the chart which indicate that there is downtrend in the market. When the dots move above the price on the chart, it indicate that there is the uptrend and price is rising up.
When there is pause in the dot series, it indicate the trend reversal. When the dot direction change, it indicate that the trend will be change now in the market.
.png)
EMA
Exponential Moving Average is also a popular and well known trend based indicator which is use worldwide to identify the market trend. This indicator was introduced to solve the LAG in the MA. The high weight is given to the price data point that occurred at the same time. In the simple MA, we face the problem of lagging. The MA is lagging indicator where the produce the late signals.
But the EMA has solved that lagging problem of MA and does not delay in producing the signals. When the EMA line move above the price on the chart, it produce the bearish signal. The exit signals are also produce when the price is trading below the EMA line. When the EMA line move below the price on the chart, it produce the bullish signal. The entry signals are also produce when the price is trading above the EMA line.
When the EMA lose cross the above and below the price, it produce the trend reversal signals.
To apply the leverage trading strategy, we will use the EMA with 200 period which will count the price data of the last 200 days.
.png)
.png)
The RSI is very popular and useful indicator which is use in the market to get to know about the market conditions like whether the market is in overbought zone, oversold zone, trend reversal, etc.
This indicator has 100 levels within which, it oscillate. When the RSI move below the 30 level, it indicate that the market is in oversold zone and selling pressure is high. The market price is decreasing and is in bearish trend. At this point, the bullish trend is expected. When the RSI move above the 70 level, it indicate that the market is in overbought zone and buying pressure is high. The market price is increasing and is in bullish trend. At this point, the bearish trend is expected.
This indicator is very popular and use worldwide by the indicator for analyzing the market
When we use the RSI with EMA and parabolic SAR, the results become more accurate the the effectiveness of the output get enhanced. Below is the RSI indicator. We can change the setting according to our own trading strategy. We will uncheck some irrelevant parameters like RSI based MA, Upper bollinger band, lower bollinger band, RSI upper band, RSI lower band, we can even change the color.
.png)
.png)
Special Trading Strategies for Performing Leveraged Trading
To answer this question, we will shift the candle stick chart to the Heikin Ashi chart which will help to identify the trend. We will use the 5 minute chart strategy here.
.png)
Buy Position Strategy
For this, we first of all will check the EMA. If the EMA is moving below the price, this indicate the bullish trend and give the buy opportunity. Then we will check the Parabolic SAR. The Parabolic SAR is represented by the dots. If the dots are moving below the price on the chart, it indicate that there is bullish trend and also produce the buy opportunity.
Then we will check the RSI indicator. In RSI when the indicator is below the 30 level, it indicate that the market is in bearish trend. This also give us opportunity to buy the coin. If the RSI also produce the buy signals, the buy opportunity will be confirmed. When the RSI is below the 30 level, it produce the buy signals. When the buy signals are produced by the EMA, Parabolic SAr and RSI, we should place the buy order because here the buy order is more confident which is confirmed by all three indicators.
.png)
The above is the screen short where the buy opportunity has been identified by the EMA. The price is moving above the EMA line which indicate that there is the uptrend and also produce the buy opportunity. Then we checked the Parabolic SAR. The dots were moving below the price on the chart, it indicate that there is bullish trend and also produce the buy opportunity.
Then checked the RSI indicator. The RSI was below the 30 level, it produce the buy signals. When the buy signals are produced by the EMA, Parabolic SAR and RSI, we placed the buy order because here the buy opportunity has been confirmed by all three indicators.
Sell Position Strategy
For this, we first of all will check the EMA. If the EMA is moving above the price, this indicate the bearish trend and give the sell opportunity. Then we will check the Parabolic SAR. The Parabolic SAR is represented by the dots. If the dots are moving above the price on the chart, it indicate that there is bearish trend and also produce the sell opportunity.
Then we will check the RSI indicator. In RSI when the indicator is above the 50 level, it give us opportunity to sell the coin. If the RSI also produce the sell signals, the sell opportunity will be confirmed. When the RSI is above the 50 level, it produce the sell signals. When the sell signals are produced by the EMA, Parabolic SAR and RSI, we should place the buy order because here the sell order is more confident which is confirmed by all three indicators.
.png)
The above is the screen short where the sell opportunity has been identified by the EMA. The price is moving below the EMA line which produce the sell opportunity. Then we checked the Parabolic SAR. The dots were moving below the price on the chart, it produce the sell opportunity.
Then checked the RSI indicator. The RSI was above 50 level, it produce the sell signals. When the sell signals are produced by the EMA, Parabolic SAR and RSI, we placed the sell order because here the sell opportunity has been confirmed by all three indicators.
Performing a Real Leveraged Trading
I have discussed the leverage trading strategy in above section. Now i will apply it to technically analyze a coin and then will perform the real leverage trading.
.png)
The above is the chart where we have been used the Parabolic SAR, RSI and EMA 200. The price of the coin is moving above the EMA which give us the buy opportunity. Then we checked the parabolic SAR. The parabolic SAR dots are also moving below the price which also give us the buy opportunity. Now we will confirm the buy opportunities from the RSI indicator. The RSI indicator was also below the 50 level. This confirmed the Buy signals. We placed the buy order.
.png)
.jpeg)
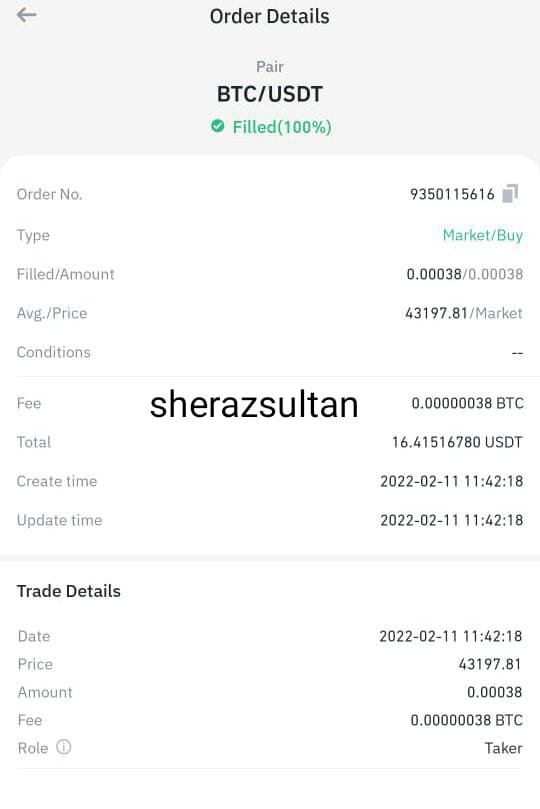
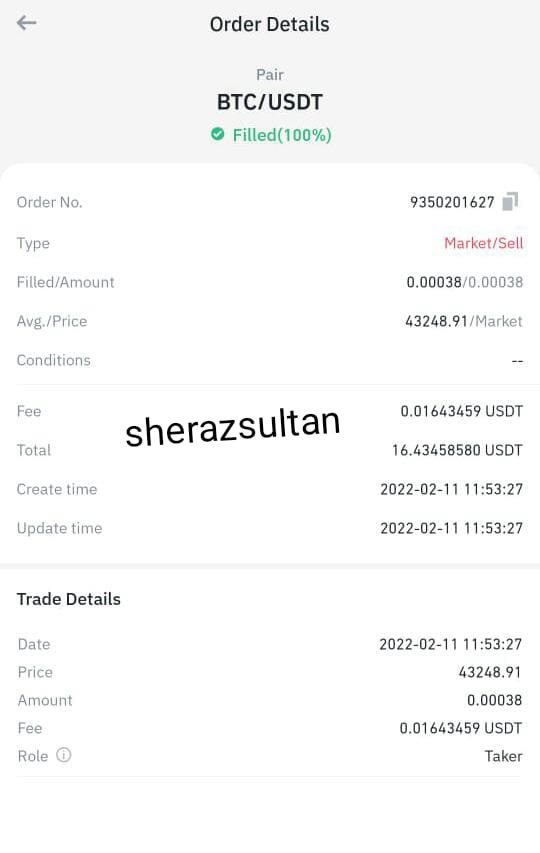
After a short time period, the dots started moving above the price which indicate that there is bearish trend. I exit from the market to safe from the lose. But i had a lose. I bought BTC in 16.81$ but sell at 16.16.4$
.jpeg)
Conclusion
The leverage trading is very effecting trading method to earn high profit with low capital. This is also very risky because here the trader may lose all their money if the coin start moving in opposite direction. The leverage trading increase the purchasing power of the traders. The traders can perform trade ten time more high than their own capital. The leverage trading enable the traders to participate in trading 100x more than their account size. This is more beneficial for the scalpers.
The scalper traders can earn high reward with little price movement in leverage trading. This is also a good way to earn high reward within short time period. The cross margin facility is provide in leverage which help to safe from risk of liquidation. There are some disadvantages of the leverage trading too. I have mentioned a few among them in above section.
Thanks to professor @reddileep
Regard: @sherazsultan