Crypto Trading with Price Action | Crypto Academy / S6W2- Homework Post for @reminiscence01
Hello, dear steemians,
I am very glad to participate in the season 6 weekly homework task which is about Price Action by professor @reminiscence01. This is my first weekly homework task. Let's start.
 Image designed in Canva | by @shemul21
 .png)
Q1: Explain your understanding of price action.
Traders utilize one of three basic ways of analysis to analyze and anticipate price direction. Fundamental analysis, sentimental analysis, and technical analysis are three of these methodologies. The majority of traders use fundamental analysis to make trading decisions in the market. And we all know that fundamental analysis is responsible for the majority of market price movement. But fundamental analysis has the shortcoming of not revealing critical price information to traders. In general, fundamental analysis takes a long-term approach to investment, whereas technical analysis takes a short-term strategy.
In the market, there are two types of traders. Banks or groups of investors, for example, have the ability to manipulate the market because of their greater purchasing power. Retail traders, on the other hand, can get a sense of what's going on in the market by simply focusing on price action. By looking at historical price movement, Price Action allows us to understand the current market situation.
For technical analysts, price action is extremely important. Most of the information needed for technical analysis can be gotten from the price chart. Many traders prefer technical analysis because it allows them to predict price direction simply by looking at a price chart. When a trader uses price actions, his or her attention is drawn to the asset's price history. Only important points on the chart, such as support and resistance levels, swing highs and lows, and trendlines, are considered by price action traders. It is sufficient to apply all of these to the chart in order to provide the correct signal.
Q2: What is the importance of price action? Will you chose any other form of technical analysis apart from price action? Give reasons for your answer.
Traders can use price action to quickly and effectively analyze the market. In price action trading we have only a naked chart for analysis. We do not need to use any complex drawings or various indicators in the chart. And this makes the analysis very easy and effective. There are many traders who depend on various indicators like Moving average, Bollinger bands, Relative strength index, Fibonacci retracement, etcetera to make trading decisions but these are very time-consuming. Many times it can affect traders' emotions. On the other hand, price action traders can take any trading decisions without taking so much stress, just following market trends, support, and resistance zones. So, we can say that price action helps us a lot to understand the market, and price action trading will increase our trading capabilities.
We can see the interaction between the buyers and sellers just only by viewing the price chart. We can also identify the psychology and emotions of traders that are reflected by patterns formed on the price chart. These help us detect the candle formation and the direction of
price trends. Demand and supply are known to drive the market. Traders can use the price action strategy to identify points on the chart where demand or supply is higher. All of this information could be identified by a trader by only using the price action strategy.
One of the biggest importance of price action is traders' confidence. In this case, the price action strategy gives us a lot of confidence when we have to trade in any situation. Cause we do not have to depend on any indicator to execute a buy or sell order. And we all know that the indicators are not give the correct signals all time. So, trading with different indicators can mislead us by providing wrong or incorrect signals which will impact our minds. But with price action, we'll be very confident and there are no doubts in our mind when taking trading decisions.
I don't prefer any other form of technical analysis apart from price action. Because without price action, I have to use different technical indicators to predict the next market movements which are really complicated, risky, and time-consuming.
Q3: Explain the Japanese candlestick chart and its importance in technical analysis. Would you prefer any other technical chart apart from the candlestick chart?
There are two types of candles in the Japanese candlestick chart. They are:
- Bullish Candlesticks
- Bearish Candlestick
Bullish Candlesticks: A bullish candle indicates that the price of an asset is rising. This candle is green in color. It is a signal that the price is increasing. This indicates that bulls are gaining control of the asset. When an asset's supply is less than its demand, a bullish candlestick appears. By generating a powerful bullish candle, it drives the asset price higher.
Bearish Candlestick: A bearish candle indicates that the price of an asset is falling. This candle is red in color. It is a signal that the price is falling. This indicates that bears are gaining control of the asset. When an asset's supply is more than its demand, a bearish candlestick appears. By generating a powerful bearish candle, it drives the asset price lower.
Anatomy of a Candlestick: A candlestick has four distinct components. They are as follows:
- Open
- Close
- High
- Low
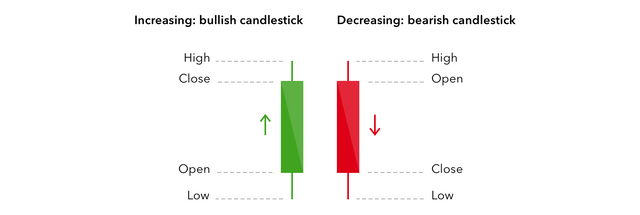 Image Source
 .png)
1. Open: The beginning of the price movement is referred to as the opening part of a bullish candle. The price movement begins here. It is often referred to as an asset's initial price. At this point, the price increases for the remainder of the day.
2. Close: The closing portion of a bullish candle is referred to as the bullish candle's end. It indicates the conclusion of a bullish candle. Additionally, it is referred to as a closing portion or price.
3. High: It expresses the assent's highest value at a particular time.
4. Low: It specifies the assent's lowest value at a particular time.
Importance of Japanese Candlestick Chart: Nowadays, the majority of traders, as well as financial institutions and markets, utilize this candlestick chart or Japanese candlestick chart to predict an asset's future price. They rely on this chart more than any other in the last few decades. Several causes are listed below:
1. Superior to Traditional Charts: Without candlestick charts, other traditional charts are illogical. They are unable to predict the market's movement in much more depth. On the other side, candlestick charts include a wealth of information. It can immediately display far more detailed information about the market's activity. It enables pattern analysis to be used to determine the probability of an equity's future movement. After some skill and familiarization, candlestick chart pattern analysis can play an important role in almost any investment methodology.
2. A Phycological Portrait: Prices can occasionally be impacted by fear, greed, and hope. We require some type of technical analysis in order to comprehend these shifting psychological variables. The candlestick chart provides insight into this investor attitude. This candlestick chart demonstrates the interaction between buyer and seller. It also manifests itself in price movement. Candlestick charts shed light on financial markets in ways that other traditional charts cannot.
3. A Proven Technique for 250 Years: For 250 years, the candlestick chart has benefited traders to analyze market price action. Homma Munehisa conceptualized it around the year 1700. Homma began trading in the rice market in the city of Sakata around 1750. Since that time, the candlestick chart has grown in popularity among traders. Nowadays, it has developed into a well-proven approach for all types of trading. No other type of chart is more useful in this day and age than candlestick charts.
4. Easy to understand: From a candlestick chart, users receive a clear and easy-to-identify set of patterns that are most effective for predicting market trends. With a basic technical analysis of the candlestick chart, you can readily begin to notice trends and patterns in the market. You can profit from these patterns when trading. It does not take months or years to become an expert at candlestick charts. You can memorize the patterns with only a few trials.
I always prefer the Japanese candlestick chart than other charts. Because I feel easy using this chart. As I told you before, The most often used charts are Japanese Candlestick Charts. Due to the fact that it shows Buyers' data in green and Sellers' data in red. Furthermore, it clearly displays the high, low, open, and close prices. That is why the majority of traders prefer to trade using Japanese Candlestick Charts.
Japanese Candlestick charts provide greater detail and accuracy than other charts. It shows the Supply and Demand for assets graphically for each period. Other technical charts, such as line charts, bar charts, and Heikin Ashi charts, provide information on price movement through the use of different graphical data representations. But we can get most of this information together in one place when we will the Japanese candlestick charts. So I prefer the Japanese candlestick charts more than other charts.
Q4: What do you understand by multi-timeframe analysis? State the importance of multi-timeframe analysis.
Multi-time frame analysis means the breakdown of the market price on different time frames. We have to analyze the condition of the market at D1,h4, or h1 timeframe. It is very important before taking a trade. Because at first, we have to make sure that we identify the market's trend correctly. So that our trading is going to be less risky. We have to start from higher timeframe.
There are 3 types of time frames:
- Long Term Time Frame
- Medium Term Time Frame
- Short Term Time Frame
There are 3 types of trends:
- Primary trends
- Secondary trends
- Minor trends
Long term time frame trends are called primary trends. Medium term time frame trends are called secondary trends. Short Term time frame trends are called minor trends.
State the importance of multi-timeframe analysis:
Without multi-timeframe analysis, we can not identify the market trends or major level support & resistance. If you are a price action trader it is mandatory for you to take decisions from multi-timeframe. A higher time frame gives you a clear idea of which direction the market is going. Medium one gives you the market structure's condition. At last on the lower time frame, you can take a trade if you are an intraday trader.
As a swing trader, you have to focus on primary trends & a longer time frame. It also gives you less noise on live market. Without multi-timeframe you can not draw the right trends line on lower timeframe. With multi-timeframe we can check the quality of a chart pattern. So, we can catch the right move.
Q5: With the aid of a crypto chart, explain how we can get a better entry position and tight stop loss using multi-timeframe analysis. You can use any timeframe of your choice.
Now I am going to show you how we can analyze a market based on a multi-time frame. I am going to break down BTC/USD chart step by step. When we are going to trade we have to start from higher time frame like Weekly/daily for major level support & resistance zone. We only draw support & resistance levels on that area where the market is currently trading.
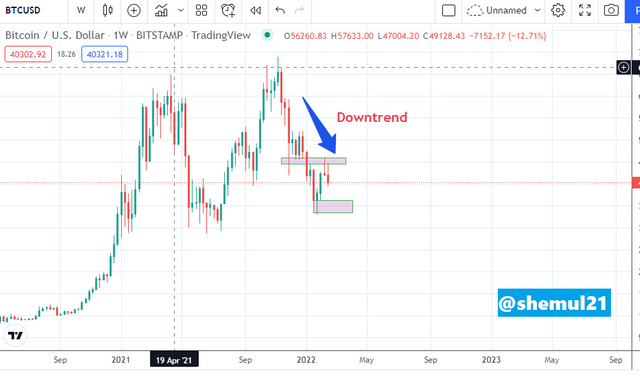 Image Source Tradingview
 We can see that market is clearly on a downtrend. Even last week we get a huge rejection from sellers. Our previous candle respects our resistance zone. Now we are moving on our daily chart.
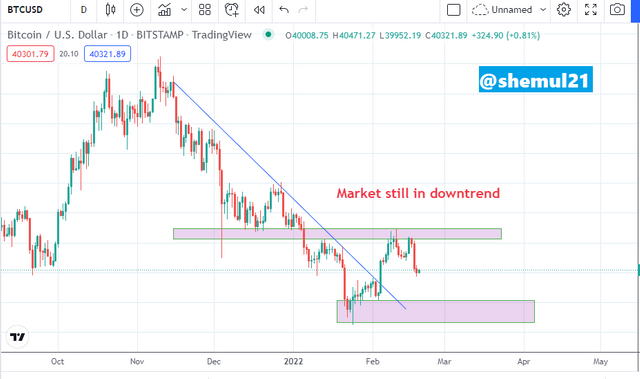 Image Source Tradingview
 On a daily candle, the market breaks a trendline but when it hits the resistance zone market nicely moves to the downside. Even the market makes a double top formation. So, we are clearly sure that our downtrend for the daily candle is valid. That's all our major level support zone. Now we gave to move at lower timeframe like 4 hours and 1 hour. So, we can draw our secondary support & resistance level.
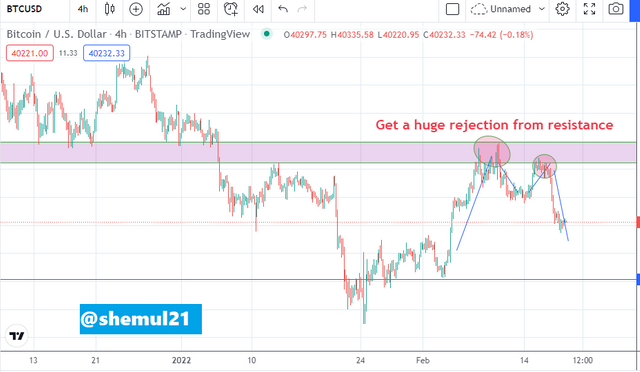 Image Source Tradingview
 We can see the clear M formation. it is so clear that our candle hits the resistance zone every time. So how we can enter a trade? Here we go if we are intraday traders, we have to draw support & resistance levels in 1 hour & 15 minutes.
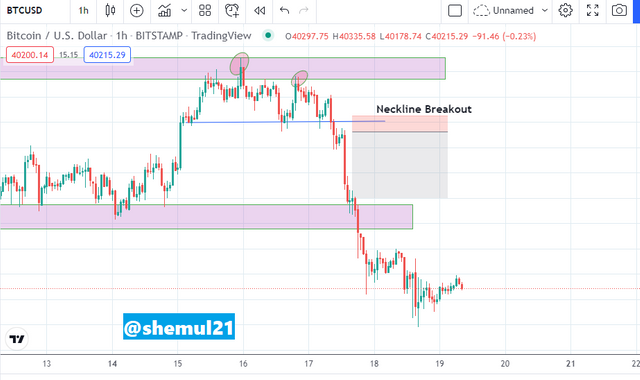 Image Source Tradingview
 In the chart it has a secondary support level that is broken. It is also called a neckline. After double top when the market will break its neckline we hit our trade on that place. Wait, we have some analysis left! Can you remember, what was our trend? Yah! Our Weekly, Daily,4hour,1hour candles are showing us not to take a long position. It is the perfect time for shorting. We have already drawn a neckline at a 1-hour time frame. Now we have to focus on a 15-minute frame.
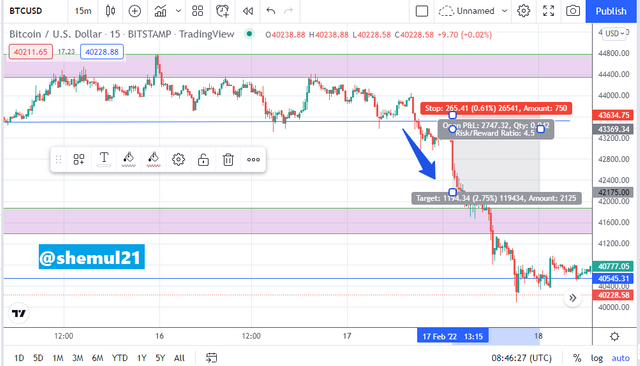 Image Source Tradingview
 Here the bearish candle breaks that support level. After breaking that line buyers try to take some advantages but our previous support zone rejects the buyers strongly. Now our support zone works as a resistance. Boom!!!
Now we are entering a trade on that candle. So we can place our stop loss just above our resistance zone. We can exit our trade before the next critical level. The profit ratio is 1:4 now. This is how we can make a multi-timeframe analysis.
Q6: Carry out a multi-timeframe analysis on any crypto pair identifying support and resistance levels. Execute a buy or sell order using any demo account. (Explain your entry and exit strategies. Also, show proof of transaction).
We have already done our multi-timeframe analysis for BTC/USD chart. From weekly to 15 minute charts we have broken down every part before our entry. In this part, I am going to take a live trade on this market. So that we will be sure that our analysis is working. This is our 1hour candlestick chart where we can see all kinds of support levels.
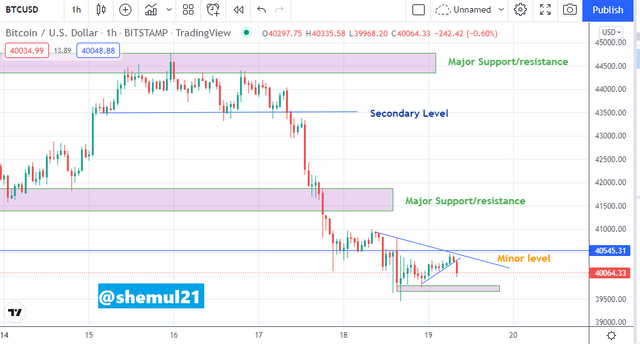 Image Source Tradingview
 We can see the major level of support & resistance which I had drawn on daily & weekly timeframe. After that, the secondary level is on a 1hour level. The third one is minor level support resistance & trendline. Now I am going to break down my entry.
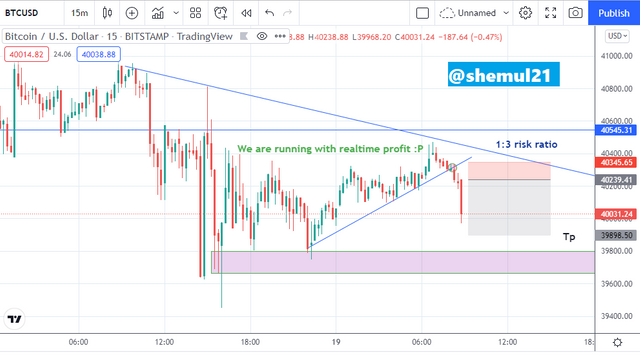 Image Source Tradingview
 We can see there is a Secondary level of resistance. Also, a trend line that crosses our resistance. Now we have to draw another minor bullish trendline & wait for breakouts. There is another chart of 5 minutes candles.
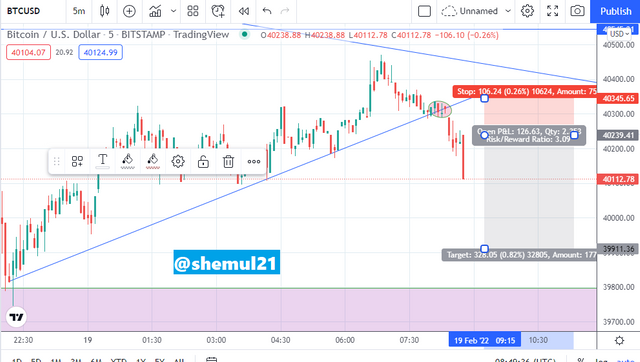 Image Source Tradingview
 On the above screenshot, we can clearly see that our level is broken. So, we can place a trade. Our stop loss is placed before the confirmation. Take profit is going to before the next critical zone. It's clearly showing that we are on profit. Below is my screenshot of the transaction.
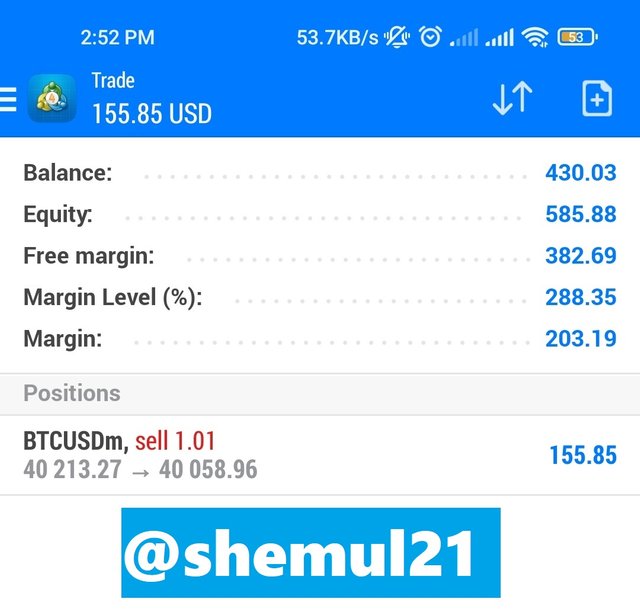 Image Source: MetaTrader 4 App
Conclusion
Most technical analysis is based on price data, but Price Action trading is all about looking at prices directly, usually on candlestick charts. Price action is highly responsive and provides a wealth of information on any price chart. Every trader should be aware of this valuable strategy of Price Action.
I want to thank professor @reminiscence01 for arranging an educative and informative homework task. I have learned a lot from the given lecture. Thanks for reading my post.
Hello @shemul21 , I’m glad you participated in the 2nd week Season 6 at the Steemit Crypto Academy. Your grades in this task are as follows:
Recommendation / Feedback:
Thank you for participating in this homework task.