Trading Strategy with Median Indicator - Steemit Crypto Academy |S6W4| - Homework Post for Professor @abdu.navi03
.png)
Cover Image - https://www.canva.com/

QUESTION :-
1-Explain your understanding with the median indicator.
2-Parameters and Calculations of Median indicator. (Screenshot required)
3-Uptrend from Median indicator (screenshot required)
4-Downtrend from Median Indicator (screenshot required)
5-Identifying fake Signals with Median indicator(screenshot required)
6-Open two demo trades, long and short, with the help of a median indicator or combination that includes a median indicator (screenshot required)

Screenshot - https://www.tradingview.com/
Median Indicator is a very useful Trend-based Indicator that we can use for identifying exact buy or sell signals. Alternatively, we have the possibility to use this indicator to take the correct entry points as compared to other indicators such as MA and EMA indicators.
The most important thing about this indicator is that we can use this indicator to find some major faults of other indicators. Because even if other indicators produce buy signals, the Median Indicator doesn't vary for fake signals such as in unsuitable entry points. Therefore, it is quite possible to use this indicator as a stand-alone indicator too.
Interestingly, this indicator can be considered as an easy-to-use indicator because of its colorful buy and sell signal generating style. It means it generates, a purple and green color Median line like a moving average and we can use that line to identify our entry and exit points quite accurately.
Furthermore, the green color median line indicates a good signal for a Market Uptrend and the purple color median line indicates a good signal for a Market downtrend.
👉Parameters of Median Indicator
For the explanation of the parameters of this Median Indicator, I have to add this indicator to my chart firstly. Therefore, I will use the https://www.tradingview.com platform to demonstrate and explain further details of its indicator and its parameters.
I can easily add this indicator by searching "Median" in the indicator and Strategies search bar.
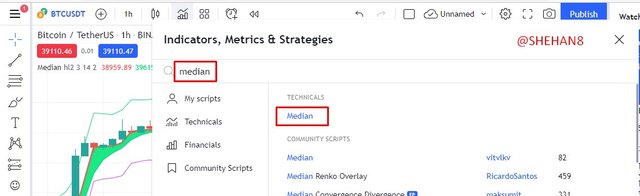
Screenshot - https://www.tradingview.com/
After that, we can easily check its parameters from the settings icon of this indicator. Further, we can see some additional parameters in addition to the time frame and length. Below I have explained them separately by mentioning its purposes.
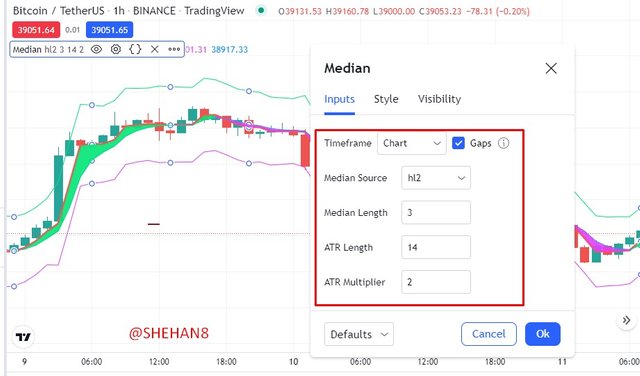
Screenshot - https://www.tradingview.com/
Time Frame - This is the major time frame selecting parameter for a specific time frame or we can select the same time format by selecting "Chart".
Median Source - This is another parameter to select the relevant source of the candle style. Here we have the possibility to select the "Open, High, Low, Close" and Ht2 options as a default setting.
Median Length - This is the traditional parameter that we can see as a familiar option in most indicators. Here we have the possibility to select relevant Length for the indicator calculation.
ATR Length and ATR Multiplier - This is another unique parameter that we can find through the Median indicator settings. Basically, here we can change settings of ATR length and its multiplier, and then the indicator generator signals will be changed according to the relevant settings.
👉Calculations of Median Indicator
Same as moving averages, it usually takes quite similar settings of the closing price and opening price for a specific period. In addition to that, it also considers highs and lows for a specific period. However, the Median indicator is a bit more advanced than those data as the Median indicator consists of an ATR indicator and an ATR multiplier. So, let me explain the relevant formulas one by one.
For the calculation of the Median value, it only considers the highest prices of candles and the lowest prices of candles. Then, both prices will be added and divided by 2 as it needs to consider an average value.
Then, the EMA value can be calculated by using the multipliers and closing prices. In addition to that, the EMA value for the previous day and the previous day multiplier will be considered as an average value for the specific period.
Finally, the ATR value will be calculated the same as the Traditional ATR indicator calculation and here it will be divided by the selected time frame.
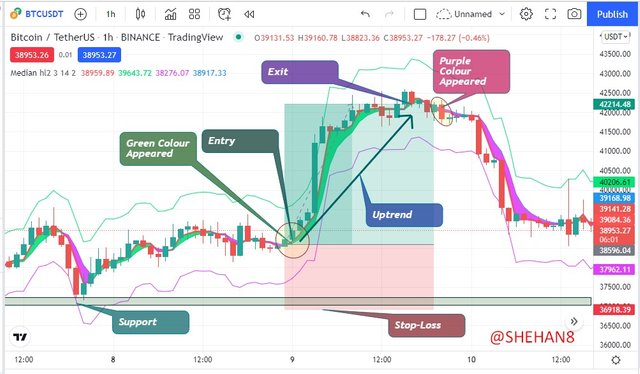
For identifying an Uptrend from the Median Indicator, we have to search for a good zone where Median Line appears as Green. That can be defined as a good buying zone and it will be a good prediction for an Uptrend.
So, in the below screenshot, I have highlighted a very good zone for taking a good buy entry. And also, I have highlighted the zone which can we use to exit from the market where the Median Line shows as Purple. Because, when the Median Line shows as Purple color indicates a price reversal to a downtrend or a quiet price consolidation.
Screenshot - https://www.tradingview.com/
In the above screenshot, we can see a clear Uptrend Market and the Median Indicator has worked very well for predicting Market behavior. Additionally, I have highlighted below a support zone to place my stop-loss point as if the price breaks this region, it can be negatively affected my price prediction.
Same as the previous steps, we can follow the reverse side of those steps for identifying a downtrend. To identify a Downtrend from the Median Indicator, we have to search for a good zone where Median Line appears as Purple. That can be defined as a good selling zone and it will be a good prediction for a Downtrend.
So, in the below screenshot, I have highlighted a very good zone for taking a good sell entry. And also, I have highlighted the zone which can we use to exit from the market where the Median Line shows as Green. Because, when the Median Line shows as Green color indicates a price reversal to an Uptrend or a quiet price consolidation.
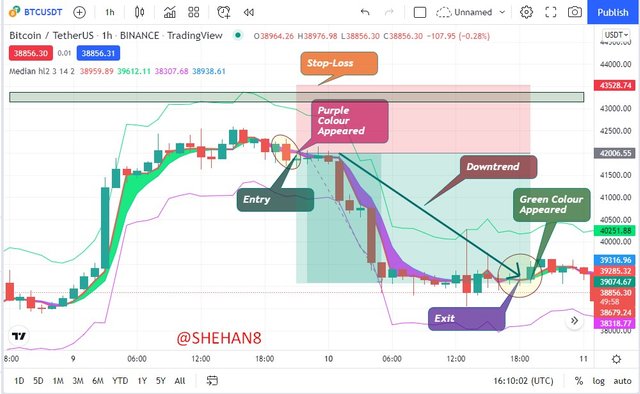
Screenshot - https://www.tradingview.com/
In the above screenshot, we can see a clear Downtrend Market and the Median Indicator has worked very well for predicting Market behavior. Additionally, I have highlighted the above resistance zone to place my stop-loss point as if the price breaks this region, it can be negatively affected my price prediction.
The most interesting thing about this indicator is that we can use this indicator to identify fake signals of other indicators such as RSI indicators. It means, even if other indicators generate buy fake signals, the Median indicator doesn't produce buy signals unless it is an accurate point for taking a buy position. So, let me highlight that type of zone through charts.
Here I will use the RSI indicator as an additional indicator to demonstrate Fake signals and I will also add the RSI indicator to the chart. First of all, I will briefly explain about RSI indicator before demonstrating fake signals.
RSI is basically a Momentum Based indicator that we can use for identifying the Momentum of any given price chart. In addition to that, here we can use this RSI indicator to identify hidden divergences such as hidden bullish divergence and hidden bearish divergences.
Traditionally, when the RSI line stays above 70 levels, we can consider it as an overbought zone or when the RSI line stays below 30 levels, we can consider it as an oversold zone. Furthermore, when the RSI shows as an Overbought zone, we can try to take sell entries and when the RSI shows as an Oversold zone, we can try to take buy entries.
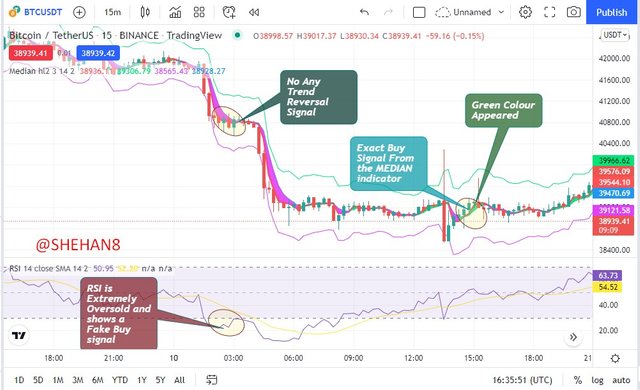
Screenshot - https://www.tradingview.com/
From the above screenshot, we can see the RSI has shown as an extremely oversold region while the Median Indicator didn't show any trend reversal signal. So, in this situation, we can take the signal generated by the RSI indicator is fake and we can successfully filter those signals using this Median Indicator.
👉Long Entry and Demo Trade
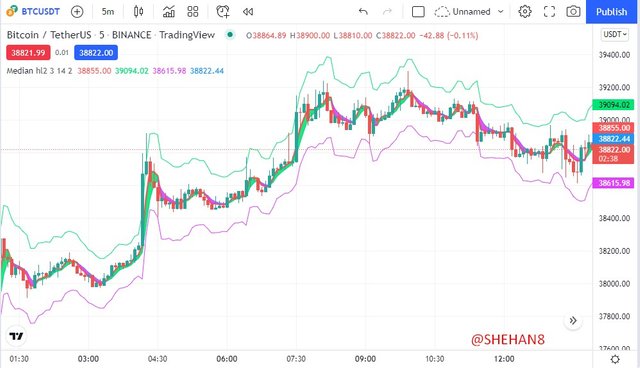
As I explained earlier, for taking a long entry, we have to wait until the Median Line shows as a Green color line. So, here I have also, taken a good scalping position to take a Long entry using a 5min chart in BTC/USDT pair.
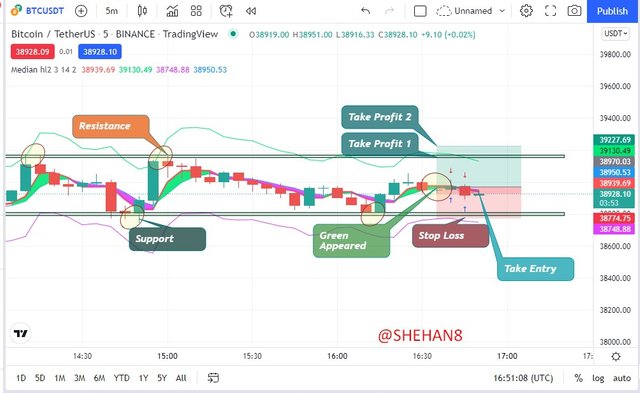
Screenshot - https://www.tradingview.com/
In the above screenshot, we can see the Median Line has shown as a Green color line and I thought it was a good entry for my long position. At the same time, I searched for a good green candle to make my entry.
Here I have marked a zone to below support level to place my stop-loss point as if the price breaks this level, it can be taken as a wrong entry. And also, I have selected 2 targets as taking profit points. The first one is a major resistance zone and I think it can be a quiet price rejection zone. So, the other target is the upper band of the ATR indicator which can also act as a price rejection zone.
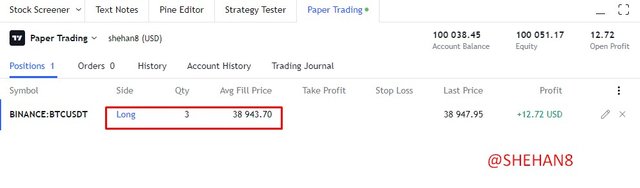
Below I have included the demo order for the above-explained Trading setup and I have clearly taken few profits as I could take my entry very well and quickly.
Screenshot - https://www.tradingview.com/
👉Short Entry and Demo Trade
Same as the previous methods, I have to follow the reverse side of the previous trading setup. For taking a short entry, we have to wait until the Median Line shows as a Purple color line. So, here I have also, taken a good scalping position to take a Long entry using a 1min chart in BTC/USDT pair.
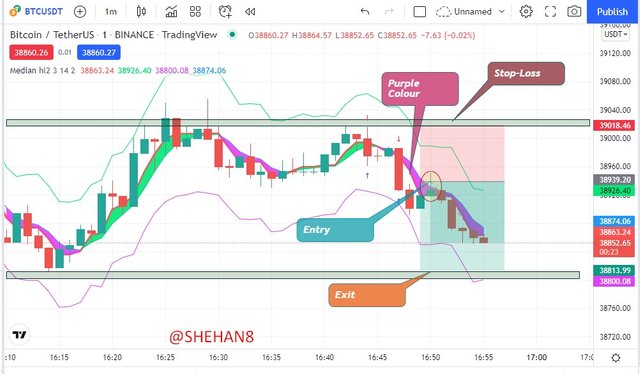
Screenshot - https://www.tradingview.com/
In the above screenshot, we can see the Median Line has shown as a Purple color line and I thought it was a good entry for my short position. At the same time, I searched for a good red candle to make my sell entry.
Here I have marked a zone to above resistance level to place my stop-loss point as if the price breaks this level, it can be taken as a wrong entry. And also, I have selected a major support zone to place my exit point as I think it can be a quiet price rejection zone.
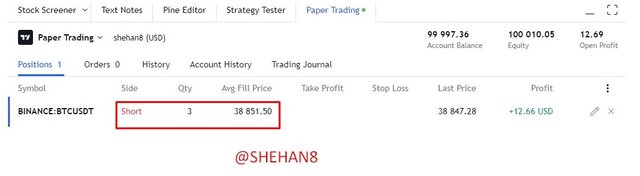
Below I have included the demo order for the above-explained Trading setup and I have clearly taken few profits as I could take my entry very well and quickly.
Screenshot - https://www.tradingview.com/
Meidan Indicator is an accurate indicator that we can use for identifying the trend of the market and the exact entry and exit point of the market. The most interesting thing is that this indicator can be used as a stand-alone indicator and we have the possibility to use this indicator as a support indicator to identify fake signals generated by those indicators. So, finally, I have to mention that there is not any 100% accurate in the Market and always we have to analyze the market using other things such as external indicators and fundamental strength of the relevant asset.
This is all about my homework post and I thank you to professor @abdu.navi03 for such a valuable topic that was really very educational and helpful for our personal life too.