Steemit Crypto Academy Season 4 - Homework Post for Task 10 [Candlestick Patterns.]

QUESTION 1 :-
a) Explain the Japanese candlestick chart? (Original screenshot required).
b) In your own words, explain why the Japanese Candlestick chart is the most used in the financial market.
c) Describe a bullish and a bearish candle. Also, explain its anatomy. (Original screenshot required)

a) Explain the Japanese candlestick chart? (Original screenshot required).

Screenshot from https://www.tradingview.com
The Japanese Candlestick Chart is a technical analysis tool dating back to the 28th century, developed by a Japanese rice trader named "Munehisa Homma" . Homma felt the need to understand the relationship between supply and demand and its effect on the market. He also wanted to know if this relationship would influence the change in future price. Currently the Japanese Candle charts are used by different types of businesses such as stocks, cryptocurrencies, currencies and other assets in the market.
Charts are used to represent the value of assets at specific times. In other words, when we look at a graph we are seeing the representation of supply and demand in operation. If the demand is higher than the supply the value of the assets increases, due to the purchases made by the merchants. Said behavior of the merchant that at that particular moment causes the price of the asset to rise. Opposite situation when the offer exceeds the demand immediately the prices go down. Due to the behavior of the trader, which causes an asset to fall in price.
A Japanese candlestick chart represents all the movements that the value of an asset experiences in different periods. This tool can determine future price change. It also has patterns that facilitate the analysis of the operator. This tool is extremely important for technical analysis because of its ability to determine who is in control of the market at any given time.
b) In your own words, explain why the Japanese Candlestick chart is the most used in the financial market.
By doing research through different financial and cryptocurrency platforms, I was able to realize that the Japanese candlestick pattern is the most used in the financial world and that is due to its simplicity and easy maneuverability, making it the most used tool by people to when making an investment in the different investment platforms.
Due to its easy handling, it is easy to understand the different patterns that can appear on the chart, I for my part with the investigation of this task I could realize that there are several patterns on the candlestick chart and here I will mention some.
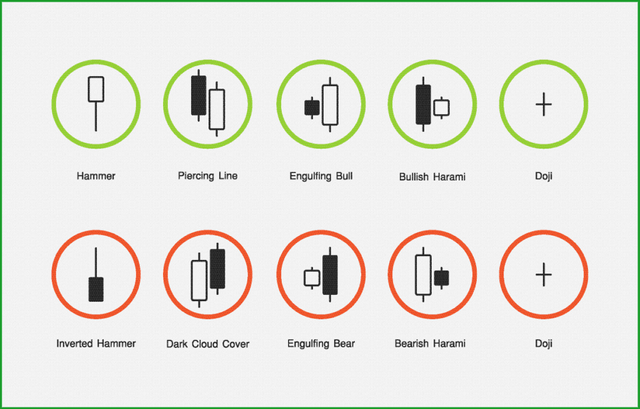
This is the Source of above image.
It is the most used in the financial market thanks to the fact that through it you can appreciate the opening price of a security, the closing price and the maximum or minimum price found in the market, the tonalities of these candles represent a value within the market as we already know, traders can have an idea of what decision to make as indicated by the candle without a doubt is a great tool that gives us a good idea of when to invest or not.
c) Describe a bullish and a bearish candle. Also, explain its anatomy. (Original screenshot required)
This is the Source of above image.
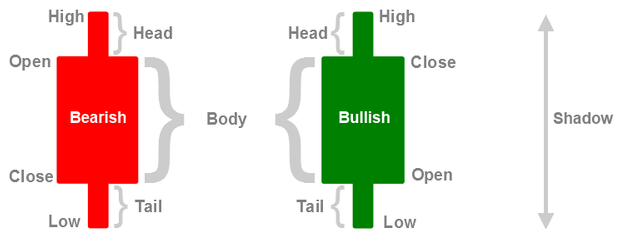
There are two main candle types in Candestick chart (Bullish and Bearish). A Bullish Candle is a green candle that represents that buyers have control, that is, the demand is higher than the offer, a candle closes at a higher price than the opening price. In addition to closing higher than the previous candle.
The anatomy of the bullish candle is made up of four parts: High, Low, Open and Close each part represents a different price point in time.
High:
- Point of the price that registers the highest reached during a specific period of time. The highest price of a bullish candle is positioned above the previous candle close.
Low:
- Represents the lowest price that the candle reached during a specific period of time. In the case of a bullish candle, if the minimum is below the opening, it indicates that the price opened but due to the pressure of the sale it directed the price below the opening and then the pressure of the purchase led it to rise again .
Open:
- It is the starting point of the candle. Indicates the start of the price movement. A bullish candle opens above the previous candle.
Close:
- Price at which the candle ends after some time. Closes are always positioned above the opening price.
Bullish Candles from Original Charts

Screenshot from https://www.tradingview.com
A Bullish Candle is a green candle that represents that buyers have control, that is, the demand is higher than the offer, a candle closes at a higher price than the opening price. In addition to closing higher than the previous candle.
The anatomy of the bullish candle is made up of four parts: High, Low, Open and Close each part represents a different price point in time.
Bearish Candles from Original Charts

Screenshot from https://www.tradingview.com
A Bearish Candle is a red candle, representing that the sellers are in control of the market. In other words, the offer is higher than the demand, a bearish candle closes at a lower price than the opening price. It also closes at a lower price than the previous candle.
The anatomy of the bearish candle is composed of four parts High, Low, Open and Close, each part representing a different price point in time.
High:
- point of the price that registers the highest reached during a specific period of time. The highest price of a bearish candle can be positioned above the open or equal to the open. But when the maximum is positioned above the opening, it indicates that the price increased due to the increase in purchasing activity. However, the pressure of the sale managed to lower prices.
Low:
- represents the lowest price that the candle reached during a specified period of time. In the case of a bearish candle, if the minimum is below the opening, it indicates that the closing price or the same, but due to the pressure of the sale it drove the price below the opening and then the pressure of the purchase. lead to climb again.
Open:
- it is the starting point of the candle. Indicates the start of the price movement. A bearish candle always opens below the previous candle.
Close:
- price at which the candle ends after some time. The closes of a bearish candle are always positioned below the opening price.
This is all about my homework post and I thank you for professor reminiscence01 for such a valuable topic that was really very educational.