Leverage with Derivatives Trading Using 5 Mins Chart - Steemit Crypto Academy S6W1 - Homework Post for Professor @reddileep

Cover Image - https://www.canva.com/

1- Introduce Leverage Trading in your own words.
2- What are the benefits of Leverage Trading?
3- What are the disadvantages of Leverage Trading?
4- What are the Basic Indicators that we can use for Leverage Trading? (Need brief details for any essential Indicators and their purposes)
5- How to perform Leverage Trading using special trading strategies (Trading Practice using relevant indicators and strategies, Screenshots required)
6- Do a better Technical Analysis considering the above-explained trading strategy and make a real buy long or sell short position at a suitable entry point in any desired exchange platform. Then close that buy or sell position after appearing trend reversal signal from the Parabolic SAR indicator. Here you can also close your Buy or Sell position using any other desired Trading Method in addition to the signal coming from the Parabolic SAR indicator. However, here you must prove that trading method as a reason for closing your position.


This is the Source of above image.
👉 Introduction of Leverage Trading
Leverage Trading is a very popular trading method among all senior Crypto Fans. Because it is a high profitable and high risky trading method when we compare it with traditional spot buy and sell orders. Here the Trader has the ability to Trade in many Cryptocurrency pairs with a certain amount of additional coins that are given by the exchange platform according to a specific contract.
This method is internally very similar to Margin Trading. However, Leverage Trading is very familiar with other derivatives trading methods such as Futures Trading which is very famous in the Binance Platform. The main difference between Margin and Leverage Trading is that we don't need to borrow any funds separately in Leverage Trading methods like Futures Trading.

This is the Source of above image.
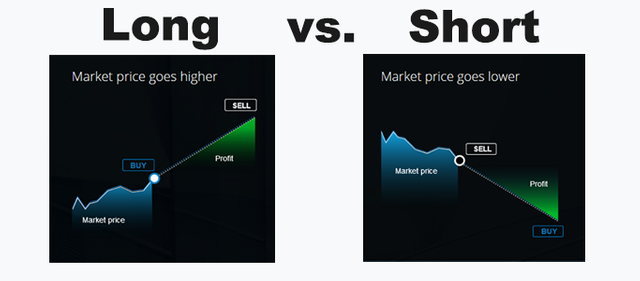
👉 How Leverage Trading Works
Mainly there are two trading opportunities for Leverage Tradings. The first one is Long positions and the second one is Short positions. A long position can be used to take profit by increasing the market while a Short position can be used to take profit by decreasing the market.
This is the Source of above image.
Basically, there are a lot of Crypto exchanges that allow Leverage Trading after the relevant Verification in their platforms. Further, sometimes, we have to answer some quizzes before entering into Leverage Trading. This is because the Trader must have adequate knowledge about the extreme risk of this Trading Method.
Further, here we can increase our entire capital on a temporary basis that is exactly the same as taking a loan from someone. As an example, if I have 100$ in my wallet, I can click on 2x for increasing my capital from 100$ to 200$. In addition to that, we can multiply it up to a few times such as 5x, 10x, 20x, and so on. Simply put, the higher the multiplier, the higher the risk. It is important to keep in mind that if the loss exceeds the initial capital, all the money will vanish as fund liquidation.

This is the Source of above image.
👉 Borrowing a considerable amount of money for Crypto Trading.
- In Leverage Trading, we can easily borrow a considerable amount of money as a multiplication of our initial investment.
👉 Very Low-interest Rate for our borrowed money.
- Here we don't need to pay much cost due to the low-interest rate as compared to Traditional Bank Loan. So, it is very beneficial for a large amount of capital.
👉 Considerable amount of Profit Taking ability
- As we can take entry for a large amount of Cryptocurrency amount, we have a higher possibility to get some considerable amount of Profit from low investment.
👉 Ability to make a profit more quickly
- If the Crypto Trader can follow an efficient Technical Analysis method, he can make a profit using very short time frames such as 1min or 5min.

This is the Source of above image.
👉 Risk of losing all the money
- As we can not keep actual coins in our crypto wallets, we may lose all the investment in an unexpected Market movement. Because, when the current loss quals to the actual investment, suddenly our initial investment will vanish.
👉 Requirement of professional-level Trading knowledge
- Unlike normal Crypto Trading, Leverage Trading must require a certain level of knowledge about Cryptocurrencies and Technical analysis. So, every Crypto trader will not be able to become successful Leverage Traders.
👉 Having to pay extra fees in addition to the usual trading fees
- In Leverage Trading, we have to pay some extra fees such as funding fees in addition to the usual trading fees. Therefore, our liquidation point may increase day by day as a result of unexpected market movements and waiting for profits.
This is the Source of above image.
👉 Exponential Moving Average (EMA)
- Simply put, Exponential Moving Average is a very popular Crypto Trading indicator that we can use mostly for identifying the market trend. EMA is basically more focused on recent price changes in the market.

Screenshot - https://www.tradingview.com/chart/
If we want to use Exponential Moving Average (EMA) for a technique of Leverage Trading, there are a few methods to use it. As an example, we can use 200 periods of EMA for identifying buy and sell opportunities in the market. When the EMA line shows below the Market prices, we can define it as a good opportunity to make buy orders, and when the EMA line shows above the Market prices, we can define it as a good opportunity to make sell orders.
👉 Parabolic SAR Indicator
- Parabolic SAR is another popular indicator that we can use for determining trend direction in a certain Cryptocurrency market. This is also a good indicator to identify exact price reversals in the market.
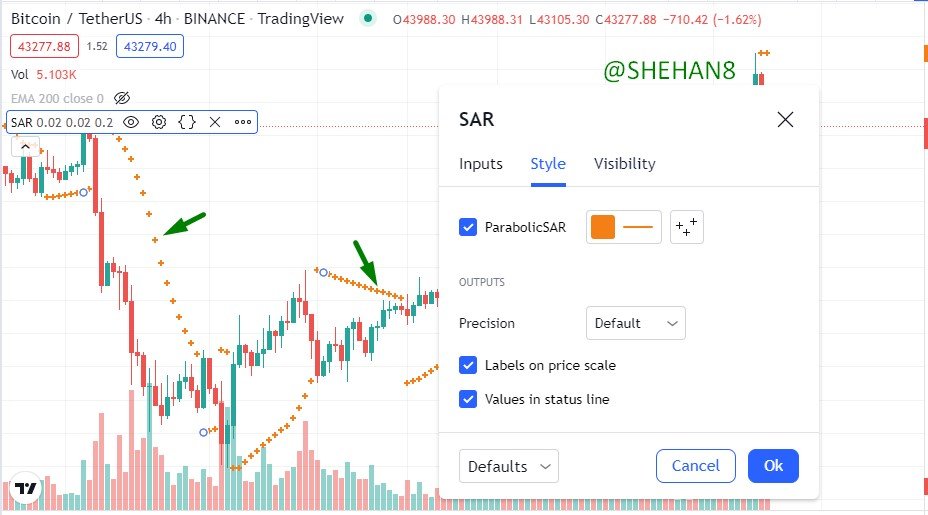
Screenshot - https://www.tradingview.com/chart/
Parabolic SAR Indicator is a bit more advanced than Exponential Moving Average Indicator. We can use it for taking exact entry points in a certain Cryptocurrency market. Furthermore, here we can see some specific dots above and below the price level. Actually, when Parabolic SAR Indicator dots show above the price level, it indicates that the market may go down. Same like that, when Parabolic SAR Indicator dots show below the price level, it indicates that the market may go up.
👉 Relative Strength Index Indicator (RSI)
- Relative Strength Index is a professional and very helpful indicator for identifying divergences and evaluating overbought or oversold conditions in the market. This is very simple in appearance but very useful as a stand-alone indicator.

Screenshot - https://www.tradingview.com/chart/
Here I have customized this indicator as suitability for our Trading strategy by removing unnecessary options that have been given by the default indicator. Here we can use this RSI Indicator to identify proper overbought and oversold conditions in the market before taking an entry. So, here we are using this indicator as a safety factor for our Trading strategy.

This is the Source of above image.
I have deeply studied the lecture given by Professor reddileep and now I have full confidence in this special Trading Strategy. Let's move to the explanation.
As the first step, I have to change my chart pattern from the Japanese Candlesticks chart to Heikin Ashi Charts. This is because it enables us to identify the market trend more clearly and somewhat accurately.

Screenshot - https://www.tradingview.com/chart/
Especially, here I have to select a 5 min chart as we are going to work with Leverage Trading and it is better to identify the specific market direction for a short period of time.
👉 Perform Sell Short order using this Strategy
Here I have to wait for taking a good entry point for my sell short position. At this time, the EMA indicator must stay above the price level. You can see below I have accomplished that requirement as the first option.
Then I need to confirm my entry using RSI and Parabolic SAR indicators. Here RSI should stay above the 50 line or Mid band and the Parabolic SAR indicator should indicate dots above the price level.

Screenshot - https://www.tradingview.com/chart/
Finally, I can close my sell short position following trend reversal dots of the Parabolic SAR indicator. Additionally, here I found a good support level for the price movement and I thought it was a good price reversal point. Especially, here I have marked a good resistance zone for placing my Stop-Loss points. Because it is very important to think about risk management methods when dealing with Leverage trading.
👉 Perform Buy Long order using this Strategy
Same like previously, again I have to wait for taking a good entry point for my buy long position. At this time, the EMA indicator must stay below the price level. You can see below I have accomplished that requirement as the first option.
Then I need to confirm my entry using RSI and Parabolic SAR indicators. Here RSI should stay below the 50 line or Mid band and the Parabolic SAR indicator should indicate dots below the price level.

Screenshot - https://www.tradingview.com/chart/
Finally, I can close my Buy long position following trend reversal dots of the Parabolic SAR indicator. Once again, here I found a good support level for the price movement and I thought it was a good zone for placing my Stop-Loss points. Because it is very important to think about risk management methods when dealing with Leverage trading.

This is the Source of above image.
I have selected the Binance platform for my real trading and https://www.tradingview.com platform for doing better technical analysis for the above-mentioned strategy.
Below I have analyzed CELR/USDT trading pair for a good sell short position. You can see, I have taken my entry from a point at which EMA stays above the price level. And also, RSI shows a quite overbought region. Finally, I received a confirmation for a good entry point from the Parabolic SAR indicator.

Screenshot - https://www.tradingview.com/chart/
According to the above chart analysis, here I have placed a real sell short position using my Binance Futures account. My initial capital is 10 USDT and I have multiplied it two times (2x) for the sell entry which means that I have total buying power for 20 USDT.

Screenshot - Binance Mobile App
After a few hours, you can see the market has clearly moved in my expected direction without any doubt. This is very interesting and I have taken a certain amount of profits from a very small investment. At this time, I have closed my sell short position where the Parabolic SAR started to appear below the price level.

Screenshot - https://www.tradingview.com/chart/
Let's check my Unrealized PNL for the relevant sell short position. Below you can see I have successfully completed my Leverage Trading following the same method explained by the lesson.

Screenshot - Binance Mobile App
This is all about my homework post and I thank you to professor @reddileefor such a valuable topic that was really very educational.