Effective Trading Strategy using Line Charts - Steemit Crypto Academy | S6W1 | Homework Post for Prof. @dilchamo
.png)

In technical analysis, the line chart may be the easiest to use, it is the representation of a line that indicates the closing price of an asset, visualizing the global movement in different time intervals. In this chart we are not going to have an opening price, nor are we going to have a body, but rather we will have a line that gives us great visibility on the chart, this being a great advantage, we can easily identify the trends of an asset and even We can get very important reaction points in an easier way since the line chart provides us with greater accuracy when it comes to finding support or resistance.
With a line chart you can get greater visibility of the structure of a market, having a line makes everything more simplified, there is less noise on the chart and that, at least for a trader with little experience, can be very useful. help. Personally, I think that the line chart should always be used in technical analysis, to get more exact points where there is reaction liquidity, the line chart can help much more than another chart pattern where there is more data and often so much noise can confuse an investor.

Screenshot - https://www.tradingview.com/chart/
👉 Uses of line charts
By using the line chart a trader can better understand the trend of the asset, they can also have an easier visualization of the structure of an asset because there is not so much noise, in addition to the fact that the line chart helps as I said before to find areas where there are many sell orders such as resistance and areas where there are many buy orders such as support.
The line chart also helps a lot to follow the price action of an asset, many traders do not like to use indicators so by following the movement of the line chart they can have a vision of where the movement of the market is headed easier and in the combination of support or resistance, execute an order to enter the market, whether for sale or purchase and thus be able to take advantage of the use of the line chart.
In all technical analysis, support and resistance will always be sought because these areas are of great importance, they represent a lot of demand or supply of the asset, and based on their reaction when they reach those levels, a trader makes a decision to enter the market in purchase or sale. Support that is usually bounced many times is very strong, so if the price reaches that area again there will surely be many buy orders that will make an upward reaction to the asset, while if we have a resistance that has lowered the price of the asset Many times, it also means that it is very strong for buyers to break through that barrier and there will be many sell orders placed that will bring the price down once again when it hits that level.
With the line chart, we are going to get peaks in the price closings, this makes it much easier to get points with total accuracy of support or resistance because we only have to draw a horizontal line that joins several points and thus we will be able to have those levels faster. Taking into account the concepts of the great importance of identifying support and resistance levels, I will show how to see it on Line charts.
Screenshot - https://www.tradingview.com/chart/
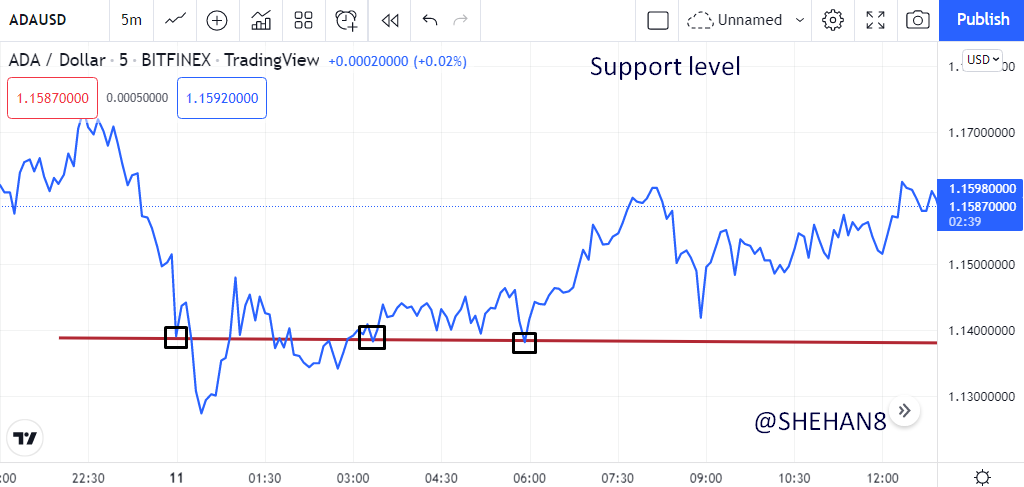
We can see in the image how support levels are found using the line chart, to ensure that it is valid to support we have to have at least three touches in the same place that confirm that it is a reaction zone where the price is already at been bounced back to the upside and so we can draw a horizontal line joining those two points or more that are at the same level. It is expected that every time the price reaches that support zone it will go up again, for that reason you can see many buy orders in that place, causing a lot of buying force and it can also be a level to adjust the stop loss in an operation following good risk management.

Screenshot - https://www.tradingview.com/chart/
We can also see here in the image how a resistance level is found using the line graph, also to have a minimum valid resistance we have to have 3 touches in the same place, after that we can draw our horizontal line that joins those points and Thus, we have a resistance that is a strong ceiling where the price usually has a fall when it reaches that level.
Resistance is formed thanks to the sales of investors, it is usually an area to take profits, and with so many sell orders executed they cause the price to end in a fall and it can also be a level to adjust the stop loss of an operation taking into account Note that the price will not rise more than that level in good risk management.


The line chart has already been mentioned that it is represented by a line that indicates the closing price, while the candlestick chart is represented by an opening price, a body that is formed with maximum/minimum prices and also the price asset closing. This clearly tells us that the candlestick chart reveals more data than the line chart, but at the level of visibility, the line chart can be much more comfortable for high timeframes since it reveals the trend of the asset much easier and filters the trend better. asset noise.
In my personal opinion, a line chart can be much easier to understand when you are starting to learn in this world of trading, due to its simplicity when it comes to seeing how the price of the asset moves, then the candlestick chart and some people With more knowledge, they can have a better vision of what is happening in an asset because there is more data that they offer us in each candle that is formed and that for me would be the main differences between these two charts.
Another of the great differences that the candlestick chart has is its color, although we can put the same color on the bearish or bullish bars, it is advisable to have different colors for each movement and this can make the movement of an asset better identified. , because if we see that there are many bullish bars with a green color that we have placed, we can say that there is great buying pressure, while if we see many red bars that we have placed, we can say that there is great pressure from sellers and instead in the line graph we will always have the same color of the oscillating line.
I think that being able to combine both charts can make a trader have a better technical analysis because with the Line charts he can get better support and resistance. While with the candlestick chart you can better observe the behavior of the price according to the size of the candles, the body, and some candlestick patterns that indicate commercial signals.
I will be using the RSI indicator to combine it with the line chart since the Relative Strength Index indicator will tell me when the asset is overbought to look for sales and when it is oversold to look for buys.
The RSI indicator will serve as the first signal of where I am going to be looking for my entry order, then it would have a support or resistance that confirms the direction of the movement when there is a break and also a trend line that can be broken by the price indicating a reversal of the movement towards another trend to follow.

Screenshot - https://www.tradingview.com/chart/
It visualizes that the RSI indicator is indicating us about buying what would be a sales signal, but to confirm the signal we have to wait for the price to break the trend line down and then for even more confirmation a break of the support that we find on the line chart. Having all these confluences, we can take a sell order in the market, using the RSI indicator as to the main signal and then confirmations with technical analysis tools that would be the trend line and support in a reversal movement.
👉 Bullish Trend
With the line chart, we can more easily follow the direction of the price, if we observe high temporalities we will better see where the oscillating line that details the price of the asset is heading, taking this into account we can place an exponential moving average to follow the trend of the asset and seek to trade in favor of the said trend. If we place a 100-period exponential moving average, we will be confirming the trend in a very simple way, since we must consider an uptrend when the price is above the 100-period EMA and we consider a downtrend when the price is below the 100-period EMA. Taking this into account, we will look for purchases when the price is above the EMA.

Screenshot - https://www.tradingview.com/chart/
👉 Bearish Trend

Screenshot - https://www.tradingview.com/chart/
Here is the ADA/USD chart where this time I find the price below the exponential moving average of 100 periods, this indicates that the trend of the asset is downward, but I confirm the direction of the price before taking an entry in sales, for that, I have to find strong support and after the price breaks the support I can look for a sale entry because I would already have 2 confirmed confluences indicating that the price is falling.
In this way I can have a good trading opportunity by looking at the line chart, combined with an exponential moving average that identifies the direction of the price, then with a support or resistance that is broken, we can confirm said downward or upward movement and thus begin to take our commercial entry to the market. There are many ways to get trading opportunities in the market with the line chart, everything depends on the most appropriate way for the trader, and in my case, I present this strategy that can give us many opportunities in the market.
👉 Advantages
You can easily observe the market trend with the line chart.
A novice trader can quickly understand where the market is heading easier because there is less noise on the chart and that helps a lot to better understand the direction with the swinging line.
Very exact points of support and resistance can be found thanks to the peaks left by the line chart.
With a good strategy you can get great trading opportunities in the market because the line chart can be a little more practical and easy to use.
The closing price of an asset is best observed, many experienced traders have commented that the closing price of an asset is much more important than the opening price and the line chart tells us just that.
👉Disadvantages
Many times it is necessary to have more information when executing an order or performing technical analysis and the line chart does not show data such as the maximum, closing, and opening price, which can often be of great value when carrying out a purchase or sale.
In short timeframes, it seems to me that it is not totally recommended and many traders who perform scalping could not use the line chart to take commercial operations.
With the line chart, we are not going to be able to find many trading patterns that are of great help and that in a candlestick chart we can obtain.
The line chart can be combined with some indicators that help us to have an adequate trading strategy, and then search for market entries through a technical analysis where our indicator has signs of confluence with the line chart. Finally to say that it is very helpful to be able to understand everything about the line chart, then it can be combined with the candlestick chart and thus our technical analyzes will be much more precise when looking for operations in the cryptographic market.
Thank you professor @dilchamo for the lesson.