Steemit Crypto Academy Contest S16W1 : Cross Assest Correlation Analysis
Hello my dear ladies and gentleman
So today I come up with another contest challenge and I always try to give my hundred percent and firstly I research on the topic and then I try to cover it fully and I try to simplify it so everybody can understand so I hope this contest is going to be very excited for all of us get started.

Explain the concept of cross-asset correlation and its significance in portfolio management. How does understanding correlations between different cryptocurrency assets contribute to effective diversification strategies?
- Firstly I would elaborate the term what is cross correlation so this is basically we measure the movement of two sides of time with relation to one another so basically in simple words this is actually the comparison of multiple time and we are trying to match with each other specific point.
- So cross co relation is basically we are using attract to see the common things in the movement of two things are two factors are any investment over a period of time and the investors actually use it commonly to see the two stock movement and to see the loss portfolio diversification needs the stock and another thing which is the investment and these are basically going in opposite direction.
- So for better understanding of cross correlation when we are my earring to different time series and basically the correlation coefficient of time is from -1.0 to +1.0
- It means that more similarities can be seen in the assests if the cross correlation coefficient value is 1
- Cross co relation is basically use in portfolio management to see the diversification in assets which are basically in portfolio so the main reason is that most of the investors are actually trying to increase the diversification of their assets just to decrease the risk of major loss.
- So let me give you an example for example the price of two technology stocks that are moving in the same direction but technology stock can we move in the opposite direction so in this aspect the cross corelation is helping the investors to pin down the pattern of movements so in this way it protects the over all over poliofolio values.
- So basically the investors actually want to see the stock movements whether in opposite direction or the same direction or see what is going on just they wanted actually to reduce the major loss and increase the stock values
- And if I elaborate the core relation between the different cryptocurrency assets which are contributing to diversification strategies so I will try to explain it that this is having a positive relationship between these two it means that the movements is going in the same direction but if we can see that the relationship is going to be in the downward or negative correlation it means that the stocks are going in opposite direction.
Explore how cross-asset correlations change during bullish and bearish market conditions. How can traders leverage this knowledge to adapt their portfolio strategies based on the overall market sentiment?
So as I already elaborated and that the core relation is basically as statical measurement and that is basically telling us how the movement occurs in relationship to each and other between two assets.
So if it is measured and minus one that is mean negative and if it is positive one it means positive so for example in 2011 they are a lot of sectors you like 500 exhibited it means that 95% a degree of correlation so the high the correlation it means it is in positive correlation.
So it is very difficult that sleep you choose the stock in different sectors through increas the diversification of portfolio so so all the investors has to see the assets to see the management of portfolio risk.
If we talk about the market sentiments as if the market is going in the bullish trend it means that the corelation is positive and if the market is in the bearish trend so it means that that correlation is negative now I will further explain it how.
Positive or bullish market sentiments means this is a very good thing for the investors and they are getting very good advantage from it with as if there is bearish trend going on in the market it is vice versa.
So if I will more simplify it means that if the positive a relationship or bullish trend so this is basically are good for investors and their getting what they want from their investment where as if the bear is trend is going it means that relationship is inverse.
Explain how understanding cross-asset correlations can be utilized for effective risk management and portfolio diversification. Provide examples of how allocating assets with low or negative correlations can help mitigate overall portfolio risk?
So diversification is mainly for investors to put in a lot of security among assets to reduce the risk.
If we see the background stocks and bonds are basically the main example of unco related assets.
So if we talk about the concept of diversification this is actually works at best level when the assets are unco related or we can say the negative correlation is in this way some part of the portfolio will decrease and others will increase.
As I already mentioned that when we talk about the diversification in portfolios it means that we are talking about the degree of relationship between two different movements of assets which are contained within the portfolios so +1.0 means the price movements are going in the same direction where as if it is -1.0 it is depicting that the prices is going in the opposite directions but a if we talk about the value is 0 so this is depicting the unco related relationship means the movement of One price has no effect on the other.
So we can see that and just like all humans are not equal or not same just like the price of the assets for example I already mentioned if we talk about the financial assets so what I will give the example of stock and bonds but if we talk about the physical assets like you can see gold so there maybe chances of opposite direction movements so if the high inflation is going on it means that we are talking about there is increase in the gold price but it can lead to decrease the price of financial asset so in this way it is easy to understand.
But if I talk about the financial stocking like stocks and bonds there are a lot of security we need and then you need to choose the asset so the aim of selecting the unco related assets is just to diversify your loss or your fair so if you are selecting the unco related assets it means that you are making sure that you are whole portfolio is not gone by one shot.
But when your whole financial assets are towards the weapon of Killers it means correlated assets can't even help.
Negative correlation means when the two assets that move in opposite direction or in simple word I can say that we are taking to assets if one is increasing the other one will decrease this is called negative correlation and another word for this one is inverse correlation.
Show the negative correlation coefficient is mainly -0.9.

- So here I am showing one example this graph is a perfect negative correlation so there are two lines x-axis and y axis and you can see that the line of y axis is at -0.8 this means that if the stroke on why axis is 1.0 so the X axis is going down which is 0.8.
- So these are moving in opposite direction and this is called perfect negative correlation.
- Another graph I am showing this is showing the positive correlation and you can see on x-axis and y-axis the stock on the y-axis is 1% and the stock on the axis is 1.6% and this is showing the positive correlation because both are in the same directions.

- And the last one is I am showing the low correlated assets so you can see there are dotted line and there is no LINE which lie on the best place so so there is no relationship between x and y axis and both are independent of each other it means that there is no relationship between them and this is called the low co related assets.

- The negative co relation I has a huge importance for the investors because for their decision to add new investment in the portfolios because there is always walterility in the market so there is re amendment which is really necessary for replacing the security that has any positive relation with negative.
- The portfolio movements as you already mentioned are mainly important for reducing the risk of loss so negative correlation is actually putting the option for the investors on the stock to get value when the stock price is decreasing.Negative correlation is from -1 to 1
- If I talk about some important examples of reality so see the negative correlation assets for example you can see the oil price with Airlines stock so this is a good example of negative correlation or we can see the gold price in correlation with stock market because usually this is not the same most of the time.
Explore the historical correlation patterns between STEEM and other major cryptocurrencies, such as Bitcoin and Ethereum. How have these correlations evolved over time, and what insights can traders draw from STEEM's behavior in relation to the broader market?
So first of all I will talk about an in detail about cryptocurrency relation and historical background so I am using 30 and 60 day rolling correlation and then I will tell you about market capitalisation.
So if I talk about the crow relation between different cryptocurrency the Bitcoin and iot a don't have any significant correlation because we all know that Bitcoin is the main driver of all the markets and Bitcoin is the king of market.
- So I took a screenshot from the investing.com and in this graph I am trying to show the percentage which is the increasing prices of different cryptocurrency and mainly I am talking about the Bitcoin etc and iot and from graph it is very clear you can see.

- This is another graph which is a trying to tell us about the relationship between Bitcoin and ETH.in this graph the Bitcoin is in red and ETH in blue. This graph is showing us of 2017 and 2018 data and this is very accurate data about through cryptocurrency and so I am trying to signify here that the stock market are trending with one another it means that the core relation is going to increase.

- This is another has a screenshot I took from market cap.com and here I am trying to tell you correlation about different a type of cryptocurrency from 2017 to 2018 and you can see here clearly about the Bitcoin ETH and steem.

- So if we talk about diversification of portfolios and in the most of the cases you can see it is going to reduces risk and and portfolio is not affected by a single shot so it means that this is basically telling us about the strong positive correlation means this is going to be very dangerous if one shoot means both will drops and I talk about that strong negative one increase the other will decrease so we are trying to slate the value near to zero for getting maximum benefit and reducing the risk so in this graph the Bitcoin is showing us low correlation coefficient so Bitcoin is most of the time a better option because the cryptocurrency with positive correlation having Bitcoin will give diversification option.
- This is another screenshot which I took from coin marketcap.com and this is also giving us 8 different cryptocurrency and telling us about the market capitalisation and from this you can also see.

- So we can see that Bitcoin and steem showing negative or inverse relationship. Means that if we see in the market the movement between the steam and the Bitcoin these are not mainly affect each other much.

[Screenshot from](trading view)

[Screenshot from](trading view)
- Where has if we talk about the Bitcoin and ETH this is mainly depicting positive correlation means the moment are going in the same direction. But over all we can see that the Bitcoin is the king of market.
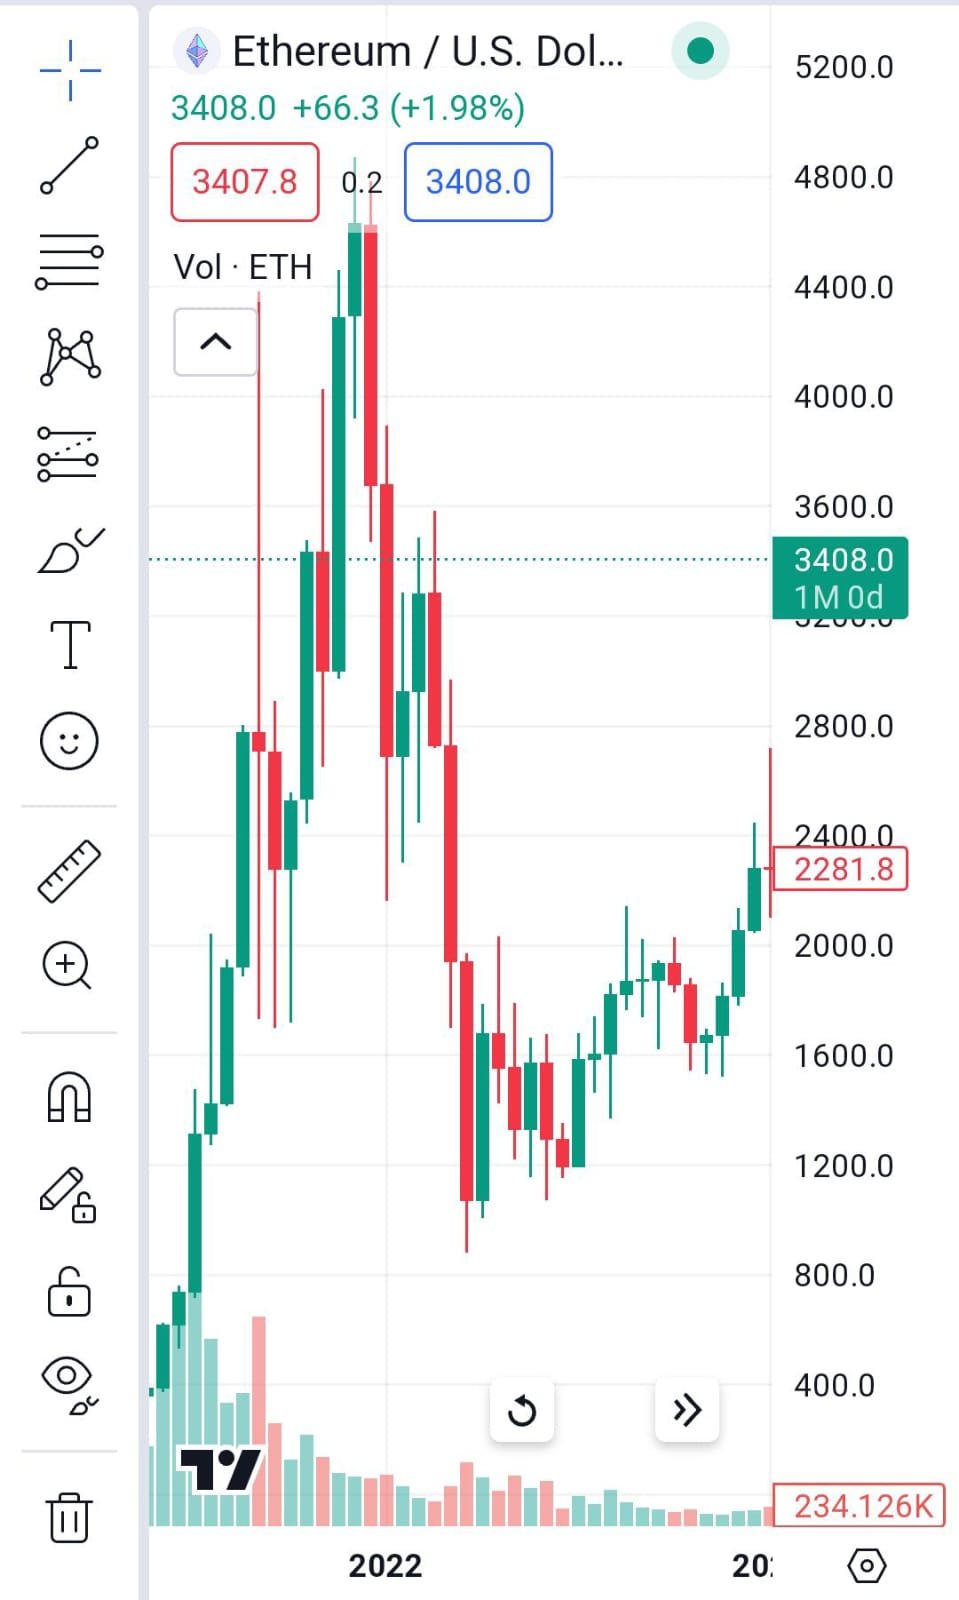
[Screenshot from](trading view)

All of pictures I have taken screenshot none of this is my property
I invite my friends
Upvoted. Thank You for sending some of your rewards to @null. It will make Steem stronger.
We will make steem stronger
You did a great job explainig cross-asset correlation! It's like watching a dance between two assets over time, where posiive correlation means they move together, and negative means they go in opposite directons. Your analogy of the market as a dance floor, with assets dancing in sync during good times and doing opposite moves when things get tricky, makes it easy to grasp.
Your idea of creating a team of asets that don't all move the same way is clever, like assembling a dance crew with varied moves. The concept of negative correlation acting as a shield for investors, especialy with examples like oil prices and airline stocks, adds a practical touch. Your clear breakdown of how cryptocurrencies like Bitcoin lead the crypto dance floor and how diversification is like choreographing a dance to minimize risk is spot-on.
Keep up the great work!
Thank you so much for such detailed view ☺️☺️ and I am honoured and pleasured to read your mind words
@shanza1 first of all Im Happy to see that You firstly research on topic then Write about all you Get from Reserch. You explained about cross asset corelatIons in very detail . I get more knowledge after reading your post . Your explanation in this article helping us to understand about the importance of investing and portfolio management.Yes im Agree with your point about financial stocking that stocks and bonds there are a lot of security we need and then you need to choose the asset so the aim of selecting the unco related assets is just to diversify your loss or your fair so if you are selecting the unco related assets it means that you are making sure that you are whole portfolio is not gone by one shot.Your examples and data analysis have helped to understand the topic. Thank you for sharing such a nice information with us appreciating your research.
Thank you my friend for visiting my post and finding my explanation is useful help you to understand stay blessed and best of luck you too
Your most welcome my dear By the way you don't need to thanks always its my pleasure 💕
😊😊😊
@kouba01
@pelon53
Please 🙏 review my post I'll be thankful
@kouba01
@pelon53 my post is still pending to review i will be Thankful please give your honoured review
You explain that cross co relation is basically we are using to see the common things in the movement of two things are two factors are any investment over a period of time. Yes correlation actually means, relating two things. Here the investors actually use it commonly to see the two stock movement and to see the loss. According to you portfolio need a diversification.
Yes this is very true that diversification helps us alot to decrease the risk Ratio. You have explained very well all the matters of cross assets correlation. The graphs and comparison of Steem with other crypto currencies are very much perfect.
Wish you good luck in the contest friend.
Thank you so much my friend for visiting and such valuable feedback
This very method called the Cross-Asset Correlation Analysis is very important to investors.
According to you, it's greatly provides us with multiple fact on the relationship, interaction of different assets.
If it's really going in same direction, the ratio and more to which helps in risk management and more.
Checking your analysis,
You've indeed done it well, relating to past history of Bitcoin and the Steem really gives us a clear term and best understanding to the strategy.
I so much love this.
Good 👍 luck sir
Oh thank you man you understand