Steemit Crypto Academy Contest S15w4 Death Cross VS golden Cross
Hello my dear ladies and gentlemen
So today another exciting contest I hope I am successful to write this article and this is actually my day and night efforts that I can write this article

Explain in your own words, what is the golden crossing and what is the crossing of death?
Golden Cross
The golden cross over these are entirely on opposite to each other so I will first elaborate the term Golden cross over what does it mean this is actually representing long term bull trend which is going forward whereas death cross over refers to long term bear term. But both of the terms are actually confirmation of long term trend with refer to short term and moving average crossover.
These are only more valued or more significant any of the trend when it is occupied by height reading volume.
So when there is cross over happens we consider that the long moving average is the major level for the golden cross where as we consider the resistant level for the death. But the investors and traders used both the death process well as well Golden cross this is to help them to consider one there is a time to enter or exit an asset. So if I do technical analysis of the Golden cross over this is basically when there is short term moving average and that will cross the major long term moving average going upsteak and this is elaborated by the experienced analyst and this is a strong signal that suggests an upward turn in the market. Show the short term average actually goes up more quicker than the long term average when there is cross over occurring.
Stages
- So there are three stages according to this graph for Golden cross
- When there is a down streaming it means that now this is and of selling which is depleted. This is we called the first stage.
- Then another stage which is called the second stage which is for when the short moving average crossing over with the long moving average this is called second stage.
- And the third stage is called the final stage and when there is consistency of trending going on and this is the good news for the investors because this is leading to rising price.
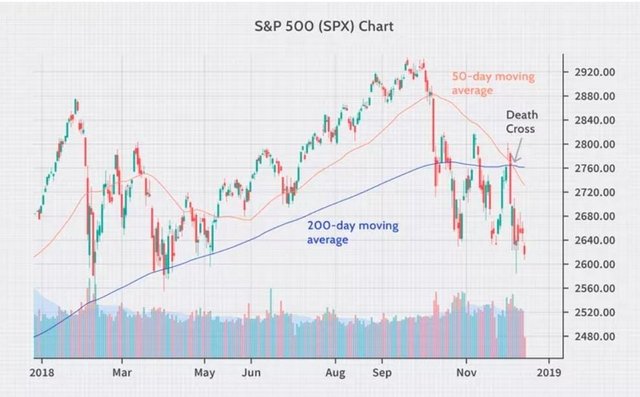
- The death cross is basically it is a downstreaming moving average which compromises the death cross and this is suggestive of the downtown in the market. The death cross is happened when the short term average trending down and crossing over with the long term average and this is going entirely opposite to the golden cross.
- Some experienced analysts define it in a different way that the crossover of a hundred day moving average is leading by a 50 day moving average Some others believe that the crossover of 200 days is the average 50 day. These are the two different definitions by experienced analyst.
- Some investors are also looking forward to the cross over happening in the lower time frame and they also confirm that up going trend and apart from time frame applied that term always is referring to short term moving average which does cross over with major long term moving average.
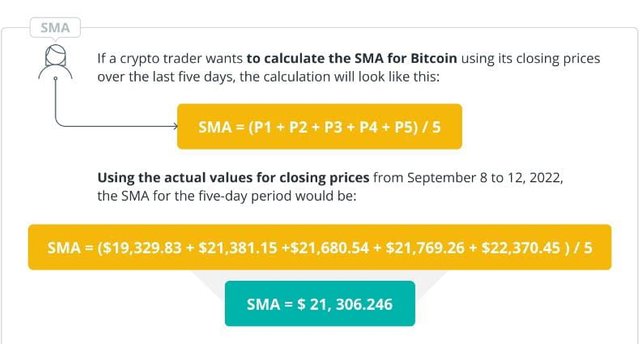
How to calculate
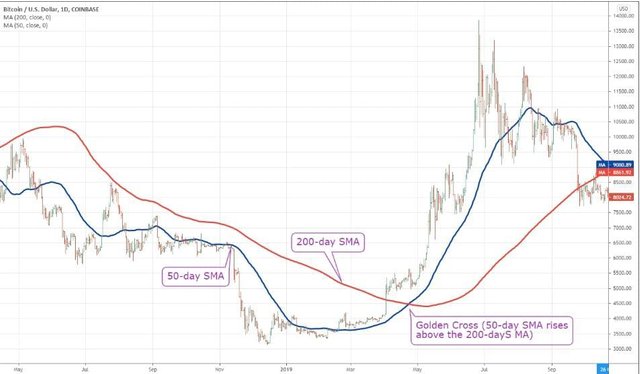
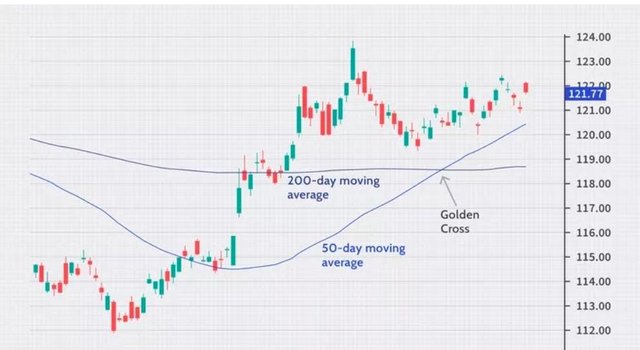
How to calculate Golden crossover so we can easily calculate on the stock chart so I will explain the chart in a detail so when there is 50 day moving average going up and going towards the 200 day moving average and then cross it this is the bullish trend and this is indication for the bio signal and with the hob that now this up stream or up trend will remain consistent.
- Another thing is many people ask is the death cross good time to buy so as we know that the cross is indicating a very strength it means it is a golden time to buy so when many analysts or many investors by the assets then at the time the value of that asset is decrease but with the hope that the price will rise in the future there can be many explanation to this drop once market stable this assets will trend up.
- Another question maybe that what is the good time for Golden cross so many investors and many analyst believed that the date readers actually most of the time use smaller time frame for example 5 minutes or 15 minutes apart from swing traders they use the long time frame for example 5 hours or 15 hours.
- So let's some up both the golden cross and death cross are used in trading and Golden cross over we are representing the signal for bull trends that signal is a bear trend.
- But both of these are representing the confirmation of long term which is with the occurrence of short term moving average and will cross over major long term moving average but both of these help the investors.
Death Cross
Death cross is basically a down trend and it is happened when SMA turn down and cross long term MA.
- This is bearish trend it is actually representing 50 Day MA cross below 200 day MA and indication of signal for downtrend.
Use the BTC/USDT pair to show the golden crossover and the crossover of death, in tradingview. Also use the STEEM/USDT pair to show the golden cross and the death cross. Screenshots are required.
STEEM/USDT
Death Cross Over
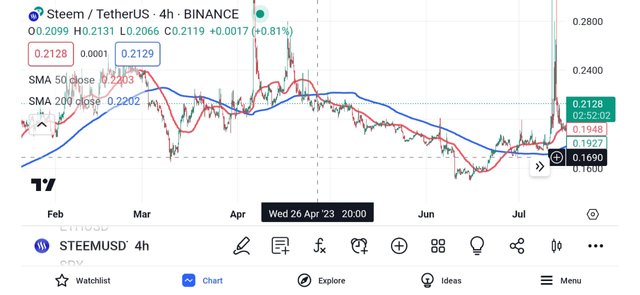
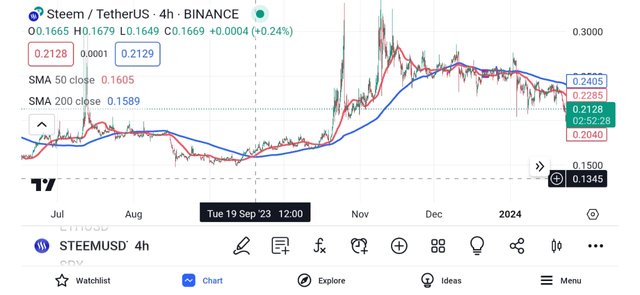
Death cross over occured on April 2023 I am elaborating it by use of chart and I have used the trading view website and open it and then select the option of the steem/USDT in this chart you can see two lines which are crossing one is the 50 day short term moving average which is crossing below the 200 day short term moving average and death cross over is formed.
STEEM/USDT
Golden cross
Golden cross is made by the cross of the 50 day short term moving average above the 200 day short term moving average.This Golden cross over formed on September 2023.
STEEM/USDT
Death Cross Over
Death cross over occured on April 2023 I am elaborating it by use of chart and I have used the trading view website and open it and then select the option of the steem/USDT in this chart you can see two lines which are crossing one is the 50 day short term moving average which is crossing below the 200 day short term moving average and death cross over is formed.
STEEM/USDT
Golden cross
Golden cross is made by the cross of the 50 day short term moving average above the 200 day short term moving average.This Golden cross over formed on September 2023.
- So the first thing to do is identification of long term trend once you have identify the remaining steps are not difficult because then you just need to look what is the golden opportunity for buy in UP trend and then you have to see the selling chance in down trend. But sometimes what happened is that many invested actually complicate it by Miss perception of lower level to buy or bull trend and voice WhatsApp for sale trend so automatically which result in loss. So how this can be prevented this is very simple chole that can help the investors use the key moving average convergence pattern and one they can see this direction they are successful now let's talk about in detail on trading view.
- As I already mentioned the golden cross is an indication of a bearish down trend. So when there is Quikr period moving average which is basically 50 day moving average and that crossover above the long term moving average and that is usually 200 day SMA.
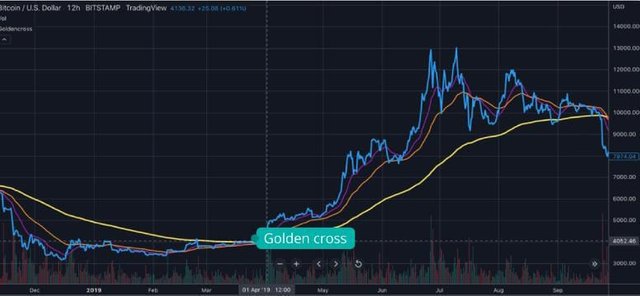
- And from this graph we can see in down trend the 50 Day SMS the 200 Day SMS both are going down so what does it mean it means that the price is reaching a very golden opportunity and all the investors will accumulate here and now this is that time to start by when the trend starting to turn up.
- So when there is a consistent trend which is resulting in 50 Day SMS and which is changing now it's direction from down trend through up trend and the 200 Day SMS is responding slowly and hence it doesn't matter whether it is increasing or decreasing or it become flat the 50 Day SMS will increase over it and it will form the golden brown so once the golden cross is being formed. So this is an indication that now the down trending has been depleted and now the uptrending trend will begin. This is also not a very transparent system Sometimes it also can give the wrong signal but there are several filter systems which can help the investors.
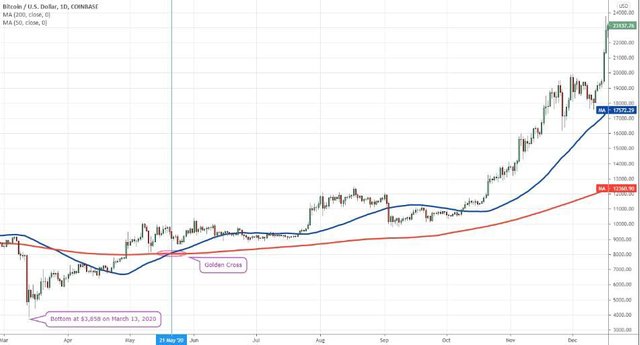
- Now I am showing another Golden cross which is showing us the profit. So we can see on 20-20 13th of the March in the Bitcoin is $3858. And the golden cross is made on May 21 and the BTC usdt pair is moved 134% and this is confirming a change. So the investors who don't have any experience see that the prices are going up and they start buying at this time. On April 14 20 21 $64,900 the golden cross which is made is about 616% and now this is the time where they investors can buy and get huge profit.
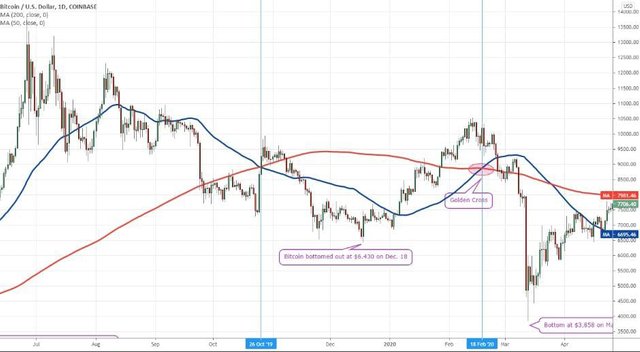
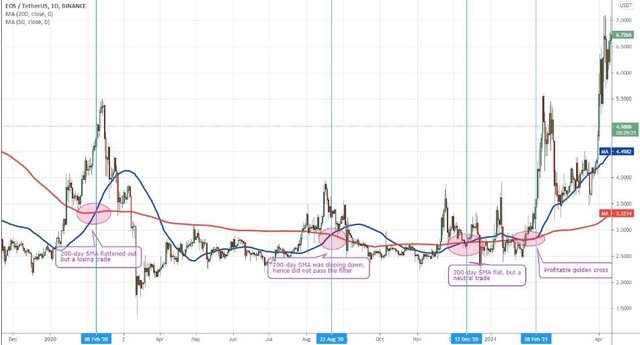
Investor should not greedy to buy if the golden cross when the 200 day sma is going down. So let me give you another example this screenshot I took from trading view on fab 8 20 20 the price is $4.76.
In this picture we can see the SMA is straight and USDT pair is $5.49.
Second gold cross happened on aug 2020 the 200 Day SMA is going down. 3rd occur on Dec 2020 so this example tell us golden cross itself is not very good indicator but along with other indicators this can help.When there is golden cross occur before than that start buy.
What is the difference between the golden crossover and the death crossover?
| Points | GOLDEN CROSS | DEATH CROSS |
|---|---|---|
| Means | Uptrend is called Golden Cross | Downtrend is called death cross |
| Implications | this is Long term bullish trend | Long term bearish trend |
| Indicator | 50 Day moving average cross above 200 day moving average | 50 day moving average cross below 200 day moving average |
| Trading time | buy signal | selling signal |
- To tell you in detail, I would like to elaborate on what is moving average this is actually we use a stock indicator that actually helps to tell us a constant updated average price. So for better understanding of death crows and golden cross moving average actually calculated in order to know that trend direction of an investment whether to know about its support or resistant level. Moving average also helps to determine whether the asset is going in the bullish which means that this is a positive upward trend or this is moving in a bearish means it is a negative or downward trend. The moving average this is a very good indicator when doing trading on the Crypto currency and we can notify into different periods of its like 10 20 50 100 or 200 day periods so when we use such period actually these are notify the market trends.
- Investors used different kinds of moving average first of all the simple moving average which is SMA means that the average price is divided by the total number of periods.
- Moving average is also known as lagging and as well these are basically on its historical background and prices so why we use moving average we use moving average to get guidance in buying or selling investment with 50 days or within 200 days of period.
So now we come to golden gross golden gross it happens when there is short term moving average or long term moving average crossover is going upward so what is suggestive of golden cross means price is going up and there is a ward turn in the market.
And the shorter moving averages are more quicker and then the long term moving average so in simple words we can say the golden crosses mainly happen when there is 50 day SMA crossing above the 200 day SMA and this is an indication of uptrend.
Cross has three stages firstly there is a down trend which means selling has been depleted Secondly, one short term process through the long term and third stage is mainly the up going trend between prices going up.
So there is 15 day moving average that is just the start of the golden cross it means that now the investors can take start to control just as short term seller then the second stage is mainly when the investors are on gain control and gradually this is going from 50 day M.A towards 200 M.A and this is time now when two periods crosses over and now it's the alarm for price are going up and but this is a wrong signal.
And the final and last stage is the 50 day MAs now consistent to go up trend and now this is the indication for over buy.
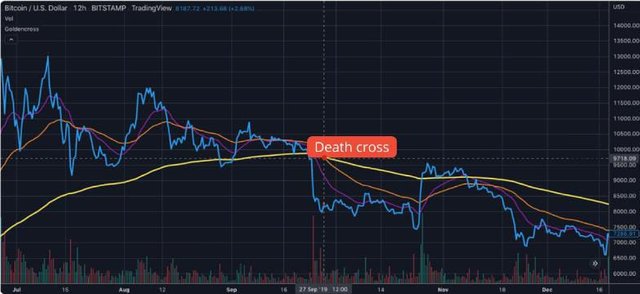
What is the death cross this is actually a down trend macross over and this is actually happening when there is short term ma trends are going down and crossing occurs at the long term. This is actually entirely opposite to the golden cross this is actually entirely opposite to the golden cross this is actually a bearish signal. And this is actually the process of the 50 day MA which crosses below the 200 MA means indication for down trend.
So there are also the same three as stages the first stage which is mainly up trend and and the short term ma is settle going up then the long term MA then the second stage is mainly the reversal now the short term ma will cross below the level of long term ma and then there is a currency of down trend which is referred to as short term MA and it is consistent to move down below the long term.
The first stage of the death cross is mainly when there is a trend and this is actually a week 50 day ma showing bearish trend and at this level the prices are going to down short term MA is diverging from the long term a now the second stage is one there is 50 day MA crosses below the level of 200 day MA now this is a very important point because this is indication that the set are now going to enter a down trend and prices are still falling.
The final stage is mainly 50 day MA continuing to go down below the level of 200 MA and now this is the signal for the investor.
Selling pressure as to liquidate their asset in order to see the further price declining.
Difference between death cross and the golden cross is the signal means indication for a trend or down trend. These both are actually opposite to each other.
- Death cross is actually the start of the long term bearish.
In addition to these two chartist patterns, what other indicator would you add to make the technical analysis more effective at the moment of making a decision.
Golden cross is a very good indicator but it only tells between two moving averages this is an indicator of bullish trend.
Some traders and investors also use other indicators as well for example the relative strength index or MACD these are used for the confirmation of the momentum.
Well golden cross and does tell us about the bullish trend but this is not only guaranteed signal but this is also good with some other indicator for example as a mentioned RSI or MACD.
So what is the relative strength index this is basically used to see the price and speed of an investment.
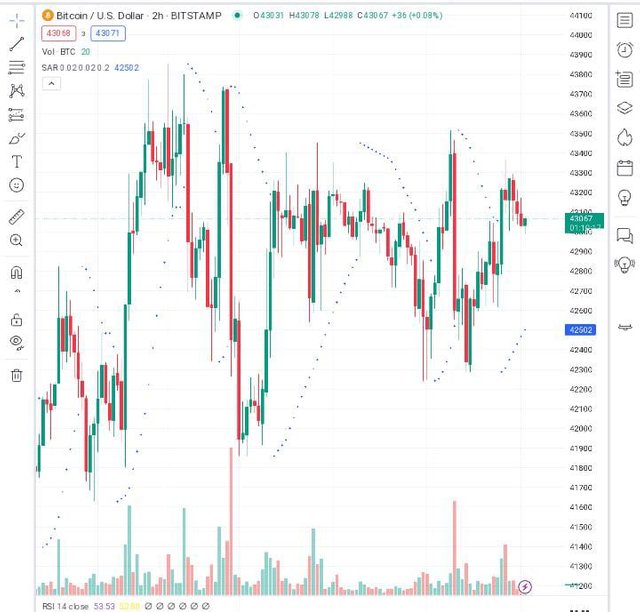
There are certain numbers we use to see this is between 0 to 100 and if RSI is 70 it means that you have over bought and if it is 30 this is an indication for over sold.
But as I already mention that golden cross itself is not a golden indicator it always works better with other indicators is the best indicator when use with golden cross.
Another way to elaborate is if the RSI is 70 above it it means that this is an indication for the golden cross or death cross it means it is going in the SMA and it should be cross above long term moving average.
- If RSI is 30 means death cross and golden cross SMA is at the level below long term moving average.

None of picture is my authority I took screenshot from different websites and I have mentioned the source.
Thank you
Upvoted. Thank You for sending some of your rewards to @null. It will make Steem stronger.
Thank you
Congratulations, your post has been upvoted by @scilwa, which is a curating account for @R2cornell's Discord Community. We can also be found on our hive community & peakd as well as on my Discord Server
Felicitaciones, su publication ha sido votado por @scilwa. También puedo ser encontrado en nuestra comunidad de colmena y Peakd así como en mi servidor de discordia
Thank you so much
Greetings friend,
You nailed it with the golden cross and death cross explanations. It's like night and day - one signals an uptrend (bullish) while the other signals a downtrend (bearish). Your breakdown of the stages for both patterns was spot-on, giving a complete understanding of how they develop and their implications at each stage. And those TradingView screenshots you shared really brought it to life as it is awesome to see real examples in action. Plus, your point about using other indicators like RSI and MACD for confirmation was spot-on. It adds depth to your analysis and shows you're not relying solely on one indicator. Keep up the great work, and all the best my friend.
Thank you so much for visiting my post and leave such positive supporting feedback well best of luck you too
You're welcome friend.
Not brother 😭😔 sister 😞
Wow! That's wonderful to know. I will keep that in mind henceforth.
😊😊😊😊
Dear friend,
I really enjoyed reading through your post.
° you have clearly explained what death cross and golden cross is to my satisfaction. Your usage of the btc chart to explain the two chart patterns was awesome.
° you also mentioned four differences between the two chart patterns which is appreciable.
° Your choice of RSI as an indicator to be used in conjunction with golden cross and death cross is fantastic. Macd can also be perfect with the two patterns. Thanks for mentioning this.
Overall. I read your post with great delight.
Wishing you the best in this engagement.
Thank you so much for such beautiful view and visiting my post ❤️❤️❤️
Hello dear, greetings to you. I hope you are enjoying the sweet moments of your life.
You said golden crossover and Death Crossover are two opposite market scenerio. Yes This is completely right. Golden crossover is made when 50 MA line cross the 200MA at upward direction and at death crossover, the 50MA line cross the 200MA line in downward direction. Golden crossover shows us upward trend, while death crossover give us a down trend. We go for long position in golden cross and make a selling position in death crossover.
The screenshot give us a perfect data of BTC and STEEM Coin. The Golden cross and Death Cross are perfectly shown here. We can see in the chart, everytime if the crossover is for golden, the market moved in upward direction and if their is down cross of 50MA, the market has moved downward.
In addition you use MCAD and RSI for your technical analysis. RSI is the most easiest technical indicator we can use, also give us accurate data too.
Wish you best of luck in the contest, keep blessing.
Wish you blessing and success too thank you for suggesting
Has evidenciado con las gráficas el entendimiento de las cruces doradas y de la muerte, así como has explicado sus conceptos y diferencias con sabiduría.
Has mencionado otro patrones o indicadores que ayudan a despejar las dudas de las tendencias o corroborarlas, como el RSI y MACD.
¡Gracias por compartir, te deseo mucha suerte y éxitos!
¡Un fuerte abrazo!
Thank you for visiting my post 😊😊😊
Thanks @shanza1 you have given a detailed explanation of the Golden Cross and Death Cross. The description of the different levels you mentioned and the screenshots from TradingView made it more clear. The use of other indicators like RSI and MACD is also very correct. Congratulations and best wishes!