Steemit Crypto Academy Contest / S14W5 -Exploring STEEM/USDT Trading .
Hello my dear steemian
I hope you are doing great second participation and this contest and this this time information and understanding of better of this topic that I am able to write about this and when I was that I can write about this so now I am able to participating in this contest so let's get start I hope in this time I succeeded to elaborate the topic fully.
Using the MACD, how can you identify a buy or sell signal for the STEEM/USDT pair? And what do the upper band and lower band in the Bollinger Bands for the STEEM/USDT pair indicate?
I have divided the questions ❓ in two parts for better understanding
Please follow along.
Using the MACD, how can you identify a buy or sell signal for the STEEM/USDT pair?
MACD is basically a technical analysis tool to see buy or sell signals in cryptocurrency or for STEEM/USDT pair.
So firstly I would like to elaborate on the term that is MACD stands for moving average convergence divergence.
MACD indicator actually is compromised on two lines which is basically one signal line and other one is MACD line then we actually use these lines to make buy or sell signal in this this particular contest about the STEEM/ USDT pair.
MACD is an oscillator which is actually calculated by subtracting
MACD = EMA 26 - EMA 12So basically exponential moving average 12 is constantly changing and it is shorter EMA and whereas on the other hand the 26 EMA is longer EMA. When both of these lines actually oscillate at the level of zero we generate a line which is called signal line EMA 9.
How the working of MACD
When the MACD will cross the level above the zero level we consider it bullish
And if it crosses below the level zero then it is considered bearish.
If the MACD line crossed the signal line by going below and above to signal this is called bullish whereas above to below to signal line is also considered bearish.
So in this way actually we use the MACD indicator to see the short term which is signal line and the longer term which is MACD line.If MACD indicator is crossing below the level of signal line then it means that this is a sell signal and if it is crossing above the signal line it's indication for buy signal.
Let me explain on chart
First I would like to tell none of this picture I am using is my authority it's all the secreen short images I have taken from one website which is trading view and other one I am using the binance app which I have downloaded in my mobile phone
Now I already login in the website which is trading view I participated a previous so I just know so many things click on the charting and I have already select the option of indicator and then from indicator MACD.
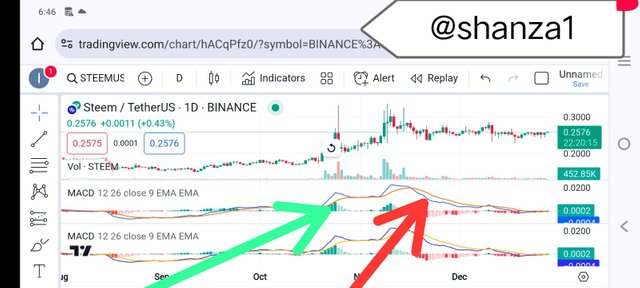
Now for better understanding and I will first explain what the dine actually represent and so there are mainly 3 graph lines which is showing in this screenshot which I took from trade view and the blue one the yellow and one is the 📉 📈.
One is the signal line and other one is the MACD line line in this graph is represented by the yellow one and the other one MACD line.
Now we just wanted to indicate in this graph actually to see the buy signal and the sell signal and then we can asset according to that.
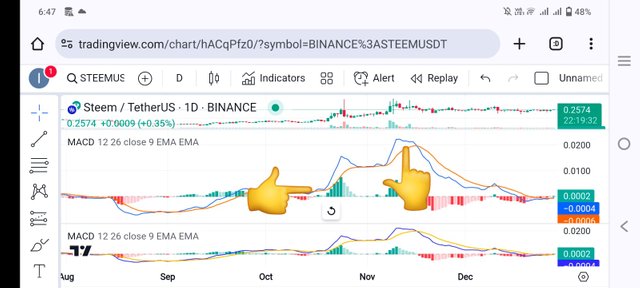
- I have used actually the arrow hands to show the buy signal and and the sell signal and in the screenshot which I took from the trading view in my example there are two of fluctuations so in the first part of the graph MACD line is crossing below the signal line which means it is time for buy signal.In this chart I try to elaborate the MACD line below and above signal line crossing which is giving us indication to make decision about setting buy or sell signals.
And what do the upper band and lower band in the Bollinger Bands for the STEEM/USDT pair indicate?
- Bollinger name suggests it is developed by John Bollinger and it's is basically to tell us about the exit and the entry point.It is strong indicator for delivering the trading signal.
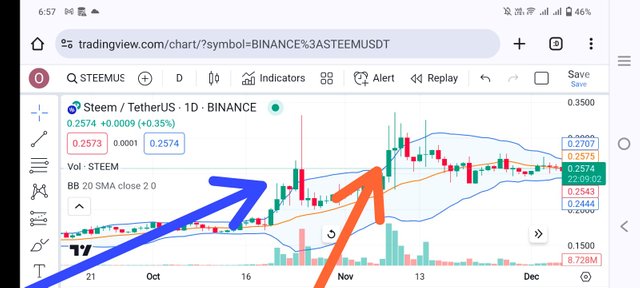
- So first I will tell about what is the bollinger bands are actually consists of three different bands the upper middle and lower.It will give idea about price movements in the market so if when the market is being over bought so it shows the upper band while if it comes closer to the middle or lower bands it's indication for Market being oversold.But on sum up I must say trading is really at risk if your only using and focusing on the bands because it will only give information about the price Volatility leaving apart the other aspects of trading.
- So again I have opened up the website and select the bollinger and then I have selected for one day so we can interpret from this graph on STEEM/USDT pair so in this graph I have represented the upper and middle and lower and I have also mentioned on this graph as well the lower and middle bands which is 20 SMA means Market over sold. Market is over bought means upper bands is clearly from this graph.
I am using all the screenshots images fromsource
How can the combination of RSI and moving average help determine entry and exit points for STEEM/USDT? And how could a trader use the Stochastic Oscillator to confirm bullish or bearish trends in the STEEM/USDT pair?
RSI is also another type of technical analysis to actually get good sense of getting trading signal and it is ranged from zero to 100.First I would like to tell you relative strength indicator good at specifically two levels of it when there is low relative strength indicator which means that the market is being over sold or it means it is the indication for buy signal it is usually below 30.
And when there is high relative strength index it is indication for market is over bought and it is indication for sell signal and it is usually 70 and in between these there is nuetral level as well which is 50 it's means that's now it's equilibrium between the bullish and bearish.
Like for other same is for RSI index it shouldn't used alone for trading it should be used in combination with others technical analysis tools.
The main difference between RSI and MA is that RSI is a leading indicator which is telling us about the market status over bought or over sold whereas the MA is a lagging indicator which means it's basically telling us the current trending status of Market.when we used both indicator in combination will tell us about the entry and exit points on STEEM/USDT pair.
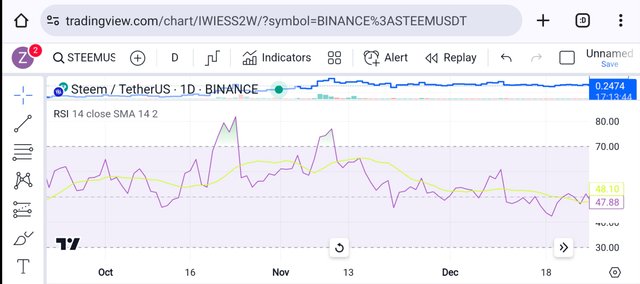
- Now I have opened my trading view website and took screen short from there I have plotted both parameters together the moving average and along with that RSI to get entry and exit points.
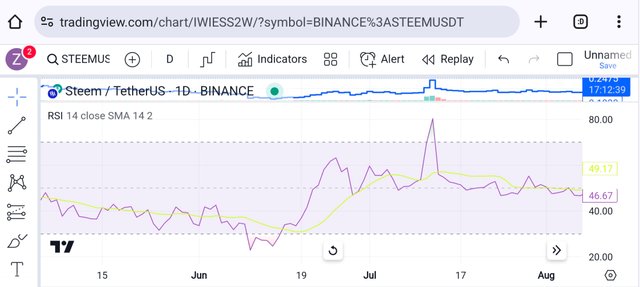
- So in this you can see it's going above 70 which is exit point I have try to add 2 screen shorts from the trading view one in which I am showing the exit point where is going above 70 and below one of below 30 which means entry point or we can simply say when the market is being oversold.
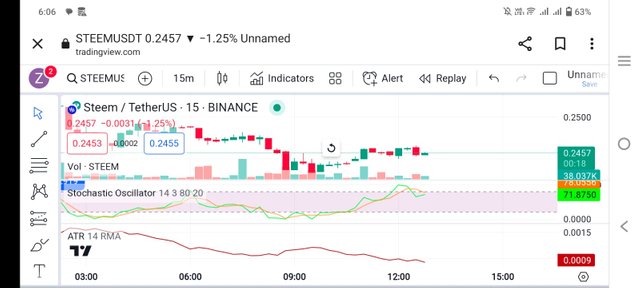
- Bullish or bearish trends in the STEEM/USDT pair by using stochastic oscillator
- Same I mentioned about RSI is it is also an indicator telling s about the market status of being over sold or over bought and it is also containing certain level which I will explain on graph if the levels is going above 70 /80 which means is overbought and if it's less than 20 oversold which will give indication about the buy and sell signal for trading.If the level is below 20 but signal this is indication for bullish and if it is 80 means bearish trend means time for asseting selling signal.
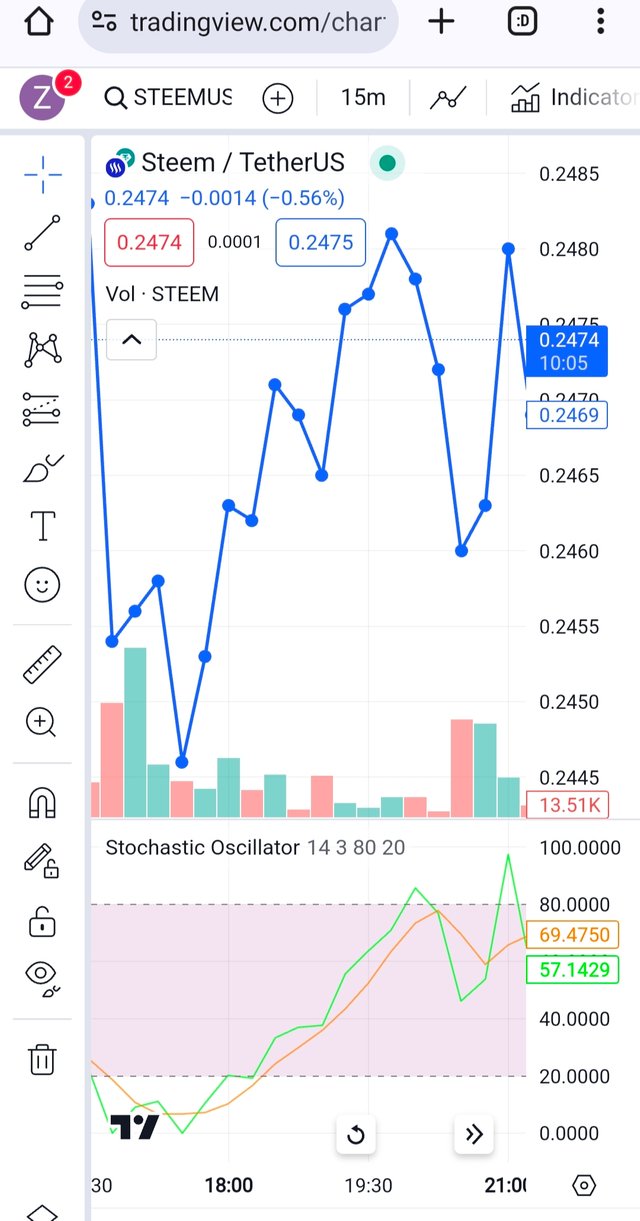
- I have opened the trading view website and there I select the indicator of stochastic oscillator in STEEM/USDT pair and then I have took screen short and showed the bluish and bearish trend and you can see above 70 is Selling signal bearish trend
And below 30 is showing the bullish trend means time for buying signal.
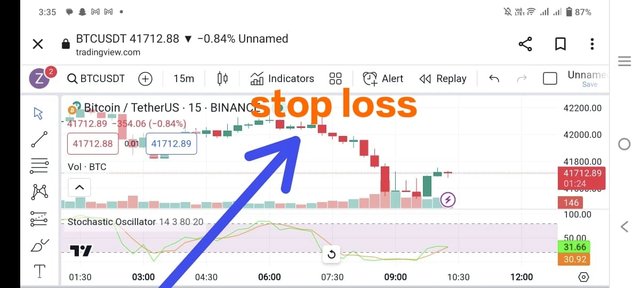
How important is a stop-loss when trading STEEM/USDT, and how can it be set based on technical analysis? Why is it essential to diversify positions when trading the STEEM/USDT pair?
- Stop loss plays significant role in limiting loss for any investor it has played really important role by providing secruity to the investor from nay fluctuations in the Market move. The main value of it is you don't need to panic about the market fluctuations daily.
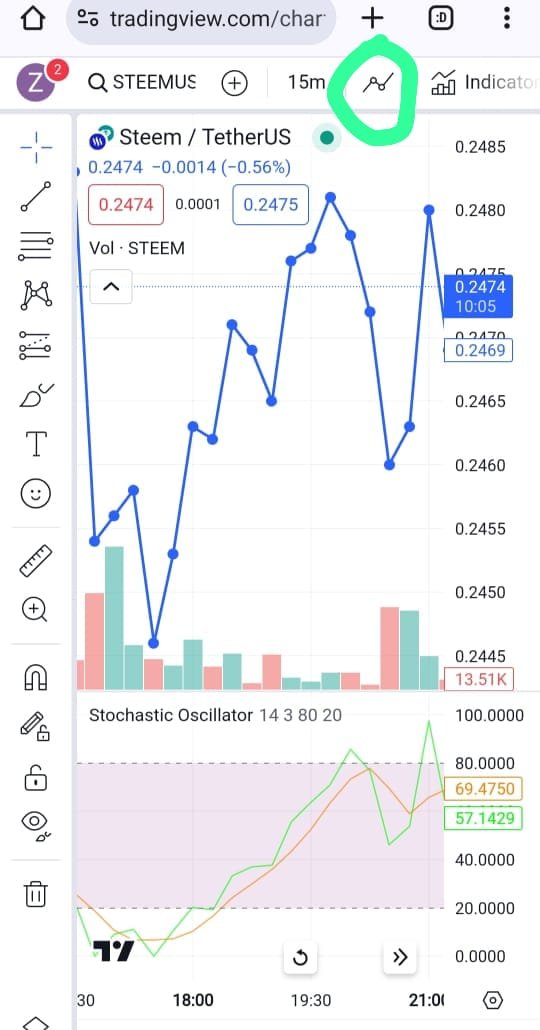
- In this example I have opened the trading view website and then I am showing here graph and will set the stopp loss here
- This is trading view website I took screen short and Than on the top I select the option I highlighted.
- And than on the candle option I will select the option for example if I want to sell the steem at let say 0.2587 and i don't want a loss or need to check the fluctuations daily so what I do I select the stopp loss so it will automatically prevent from me from loss.
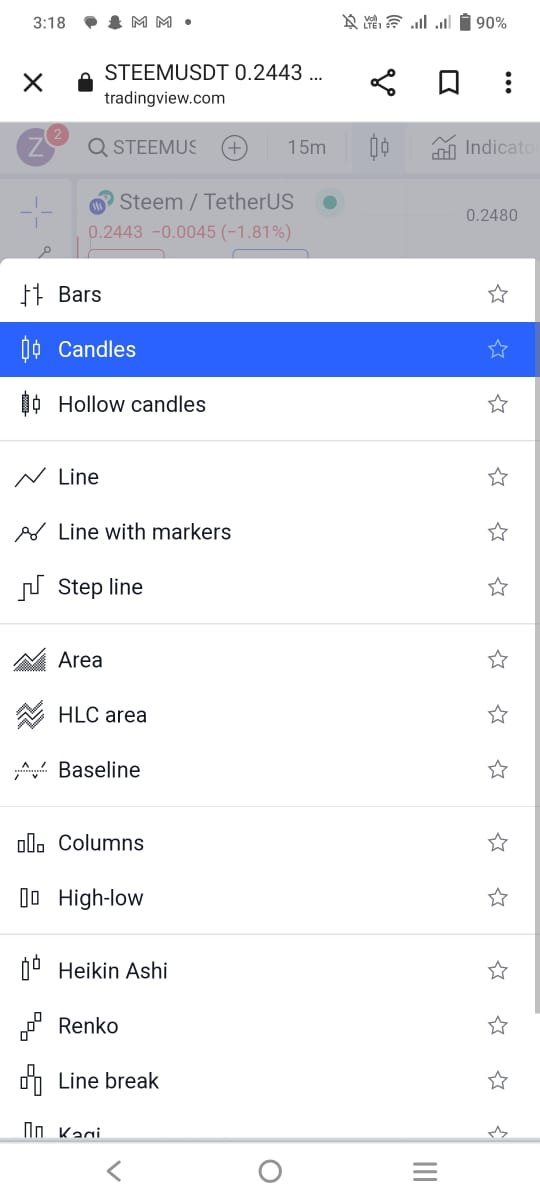
- This is whereas I see the downtrend so I have set the stop loss.
To diversified the positions actually it is really important while when we are working on STEEM/USDT because it is actually preventing us from loss and I think this is really important because we don't know the market fluctuations where down trend goes so if we want to secure our investment then diversification of the position is really important.
Actually a advantage for us because it will lesson the risk strategies and this will also improve our performance of being panic while investing in the afraid of loss and an as well as you can have experience of different type of the methods by which you can get our profits may in a specific market trends.
There is also one great advantage that the Volatility effects can be reduced by setting the diversity position to attain profits.
What fundamental factors should one consider before taking a long or short position in STEEM/USDT? and how can external events, such as announcements related to STEEM or stablecoins, influence the trading of the STEEM/USDT pair?
- So firstly the long or the short position in STEEM/USDT it actually have a sentimental value while doing trading so the higher the value it means that this is a suggestion for bullish and if it is lower than it means that bearish.
- Before asseting in particular market we need to know about this sentimental value and this is actually make that trader decision ,opinion and action more stronger and which is then according to that it is analyse and set the trends.
- So this actually represent two sides of the market first like if the sellor is taking a long position it means he is expecting much higher from his selling point while if I talk about the short position it means it is decreasing from a particular point.Same like in crypto currency you are taking while short position or long position means selling or buying your assets in market so there is a significant chance of profit.
- How to calculate the long and short positions this is simply by dividing the number of it for example if I am taking the 120 long positions and along with that there are only 60 short positions so this will 120/ 60 the ratio will be 2.
So in short we can say in the cryptocurrency assets the short and long positions play a very significant role for the traders to actually for the market sentimental values and their for they can identify risk management and more strategies to monitor the trading - But the same time and they are not alone use they are other technical indicator which are also being used to prevent any risk or to get more profit according to market friends
- And the most importantly we can see the market fluctuations which are always going on so we can also get updated regarding the market fluctuations and market regulations as well so this is really important.
how can external events, such as announcements related to STEEM or stablecoins, influence the trading of the STEEM/USDT pair?
- Yes external event or certain announcements which are related to steem actually influence the trading so much and it can influence whether gaining profit or sometime in the loss so I will share my particular example one of my friend who is working very good on the on this platform and once there was news that steem price went on 74 on that day and one of her friends said and this will not increase so she sold out 5000 steem on the same day and other next day steem went 94 so she losses so much so in this way certain announcement does actually effect the trading so much it can be in the form of loss or again in that trading.
Apart from commonly used indicators, what other leading indicator could be useful to analyze the behavior of the STEEM/USDT pair? and how can trading volume be interpreted to predict future movements of STEEM/USDT?
There are many other indicators such as
ATR
Trading volume Etc
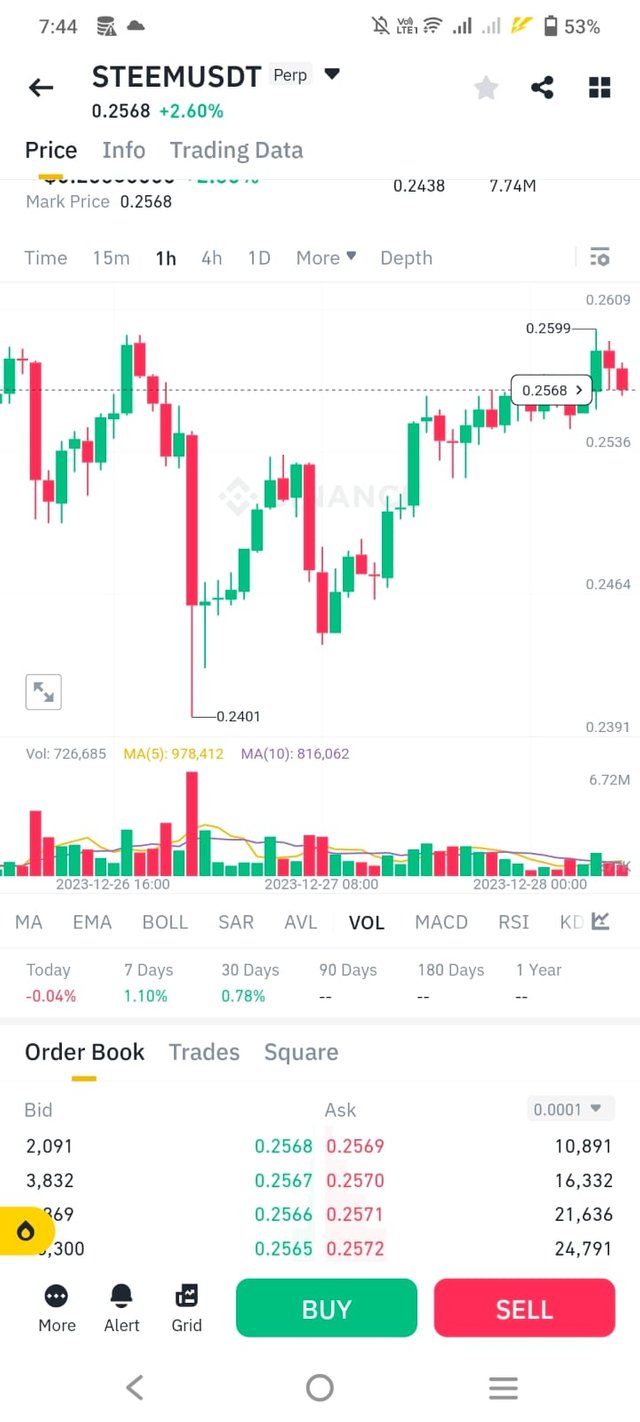
[Secreen short Source(binance.com)
So yes and they are some indicator which are actually leading indicator very useful to analyse the behaviour of steam us needy period and so firstly I will never it about the trading volume so trading volume is actually this is another indicator to see the steem price fluctuations in the market.
If the volumes are increasing it means that there is incresed market of buyer and seller and if it is lower means less marketing going on.
Is chart which is I am showing the pair of the steam usbd it in this charge green area is where more buyer can be seen whereas red mean volume so in this particular example there are more buyers rather than saller which is very clear from screen short which I have taken from my binance app.
This is from my trading view website I am showing another parameter which is average true range this is another indicator to see the Volatility in the market and it also see the price fluctuations.
And in this particular chart the green and red area representing the Volatility means if ATR increasing it means the more volatility.
I have used all the secreen short images from trading view website none of this is my property and one from binance app.
Conclusion
So honestly speaking I have spent my day and night me talk about in detail regarding all the questions and I have tried to give each and every question as much as I can and I think I give my 100% and still I am in learning process so I will keep on learning from all my seniors were really working hard over here
MACD and its technical analysis
RSI and its technical analysis
Fundamental factors in STEEM/USDT
leading indicator
I will invite my friends
Las Bandas de Bollinger me parecen las más útiles pero sabemos que debemos complementar el análisis técnico con otros indicadores como MACD, RSI y Oscilador Estocástico que nos indicarán donde entrar y salir, con cuánta fuerza se impulsa la tendencia y cuánto podemos arriesgar en pérdidas.
Supongo que hay muchos más pero creo que con aprender de estos es suficiente para empezar en cuanto al aspecto técnico.
Sin embargo, el análisis fundamental es tan importante en algunos momentos que pueden echar por tierra nuestra perspectivas que el análisis técnico nos pueda brindar, aquí las estrategias comerciales son importantes tanto como la experiencia en este mercado volátil por excelencia.
Gracias por compartir. Te deseo mucho éxito y ¡Feliz Año Nuevo!
Thank you my dear friend I have spent day and night to have batter understanding of the topic and I hope I will keep on learning more and more about crypto iny coming days thanks for you comments
Es un placer. ¡Buena suerte!
Hello dear.
A great article you have written here. Stoploss is very important in. It helps a trader to trade with rest of mind, know that his losses ia only limited to what he has setup.
This gives the trader the opportunity to enter another trade next time.
So in reality, it protects the traders capital.
I wish you the best in this engagement,
Thank you my friend it's just your seniors support and understanding of this topic that I am able to write about this topic and your one of the inspiration for me in crypto thank you
Salutaciones, apreciado @shanza1! 🚀
Me sumerjo en la minuciosidad y exhaustividad de tu análisis concerniente al par de negociación STEEM/USDT. Tus esfuerzos al explicar diversos indicadores técnicos como MACD, RSI, Bollinger Bands, Stochastic Oscillator, y su aplicación para identificar señales de compra o venta, son dignos de elogio.
La inclusión de gráficos y capturas de pantalla de plataformas de negociación introduce un componente visual que eleva la comprensión de estos indicadores complejos. Es evidente que has dedicado tiempo y esfuerzo a investigar y presentar la información de manera meticulosa.
Además, encuentro perspicaces tus explicaciones sobre establecer el stop-loss y la importancia de diversificar posiciones. La gestión del riesgo a través de órdenes de stop-loss es, sin duda, crucial en el comercio, y tu demostración de cómo establecerlo utilizando plataformas de negociación agrega un valor práctico a tu contribución.
Adicionalmente, abordaste la importancia de eventos externos y anuncios en la influencia de la negociación del par STEEM/USDT. Esta conciencia de factores fundamentales añade profundidad a tu análisis, reflejando una comprensión holística del mercado.
En resumen, tu entrada está habilidosamente estructurada, llena de información, y demuestra un sólido entendimiento de los aspectos técnicos y fundamentales del comercio. ¡Sigue con el excelente trabajo y aguardo con interés más de tus contribuciones en el futuro! 🌟📈
Thank you my dear friend you go through on such detail In my post and it's I think my seniors support who keep on teaching me to write about the post and it's I think seniors support 😄😄 thank you
This indicator are very important to traders and I love how you easily broke them down into simpler terms or definitions.
Peace indicators are so powerful and influential in a crypto market that almost every trader add this to choose the use to confirm and predict prize movement of an access do you need period of time. And in turn it generates profitable signals
Thanks for sharing wishing you success please engage on my entry https://steemit.com/hive-108451/@starrchris/steemit-crypto-academy-contest-s14w5-exploring-steem-usdt-trading
You are master in crypto it's just my small effort to write about this post thank you friend sure I will read your post as well
Greetings friend,
Your article is fantastic, and you're absolutely right about the importance of stop-loss in trading. It's like a safety measure that helps traders protect their capital. With stop-loss, you set a limit on how much you're willing to lose, which gives you peace of mind. It also allows you to move on to the next trade with confidence. So, in a nutshell, stop-loss is like a shield that safeguards your trading capital. Keep up the great work, my friend. Your insights are spot on.
Absolutely, external events and announcements related to STEEM can significantly impact trading outcomes.
Your friend's experience highlights the importance of staying informed and the potential consequences of acting on market predictions.
Such events can indeed lead to either gains or losses. Thank you for sharing this valuable example!
Thank you my friend for going through my post and thank you for supporting me to write again and have hard work and faith for writing
Bitcoin will grow in price until the middle of 2024. And it will reach a price of $ 55,000 per coin, after which the correction will begin. This post is to encourage my analytics.