Advanced Trading: Multi-Timeframe Analysis and Market Cycles"
Fluctuations in the stock market are a very cardinal factor regarding buying an selling of financial securities including cryptocurrencies. Knowledge of those oscillations might help traders maximize potential benefits, as well as predict market tendencies and effects. There are four main phases of market cycles: the four A’s of growth, comprising of; accumulation, expansion, distribution, and contraction. Let's take a deeper look into each phase and their significance in cryptocurrency trading:
Accumulation Phase:
The accumulation phase is the first phase of a stock market cycle and this is the time when the markets are low and institutional and smart investors purchase stocks. They do this with the assumption that the price is going to rise shortly; based on the laws of demand and supply. In the cryptocurrency market, this phase usually comes after a bearish run or after the cryptocurrency has been oversold for a long period. Usually, accumulation occurs during a period when the overall market climate is bearish or when an offshoot of a bull market there are few buyers for most stocks. Sometimes during this phase trading tends to be slow, and this is often accompanied by high flucuating prices. The focus of traders during the beginner phase is to find cheap assets with good fundamental credentials and even stronger future returns.Expansion Phase:
After the stock has been bought by early investors, it becomes available for trading and the market moves into its second phase, the expansion phase otherwise known as the “bull market”. During this phase, the price of the cryptocurrency begins to increase since more traders are becoming interested in the new Digital Currency. Higher trading volumes, penetration and positive media coverage are typical of this phase. The specific stage may be the most profitable for traders since prices always go through rapid increases and the probability of getting a negative result minimal. The expansion phase of a cycle may also be characterized as slowly swinging near the end of the phase and traders should be careful of this since it may be the beginning of the next cycle.Distribution Phase:
After reaching its apex, the state of market distribution starts. At this stage, those individuals with long-term investment horizons and early speculators, intending to produce profits, begin to sell Bitcoin in the market, while institutional investors and other wise traders start purchasing the cryptocurrency at increased prices. This is the kind of setting where value of the cryptocurrency may rise to another level, although the rise in the price may be witnessed at this phase. The distribution phase is distinguished by such factors as higher turnover, a greater number of players involved in trading, and lower average emotions level. Traders should be very careful during this phase because it is very difficult to determine whether that is the best high the particular market will attain before starting to go down.Contraction Phase:
The contraction phase is also referred to as the bear market and succeeds the distribution phase to complete a market cycle. During this phase, the price of the cryptocurrency starts falling since people who need to sell their assets do so. There’s decreased market adoption, focused negative publicity, and even higher market instability that all lead to the decrease in price. This phase is somehow the most dangerous phase of trading for the trader since there is high risks that may lead to losses of capital. The principal objectives that have to be set by traders throughout the contraction phase include such steps that focus on choosing the available assets with good bases or prospects for upward movements and avoiding critical losses to capital.
Therefore, market cycle is very important when it comes to trading in cryptocurrencies since it enables traders to make right decisions when markets are indicating certain trend. Realising the peculiarities of each phase enables the trader to get into the accumulated phase which indicates underpriced assets, make profits from the speedy growth of an asset in the expansion phase, negotiate the price volatility of assets in the distribution phase and to protect an individual’s capital during the contraction phase.
Multi-Timeframe Analysis: An All round Reference Framework For Spotting Trends And Reversals Of Market Cycles
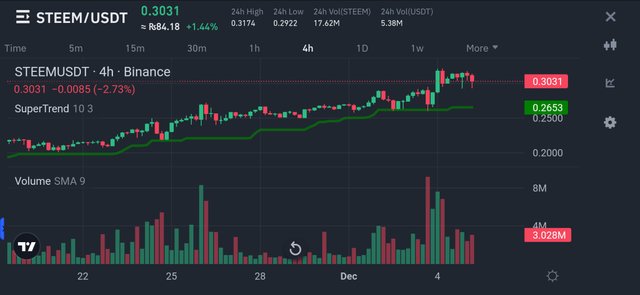
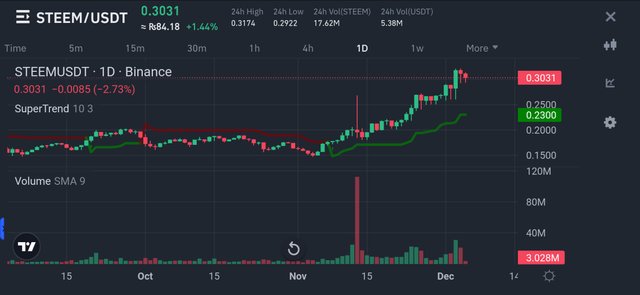
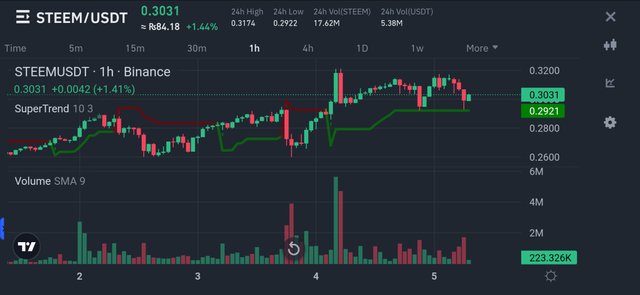
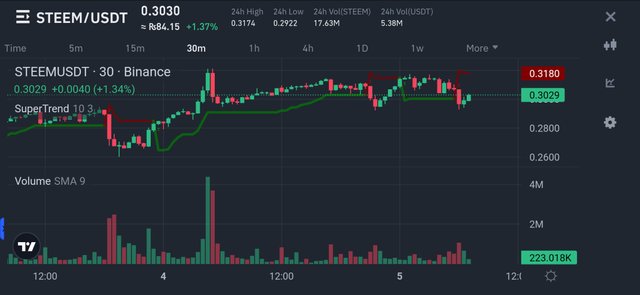
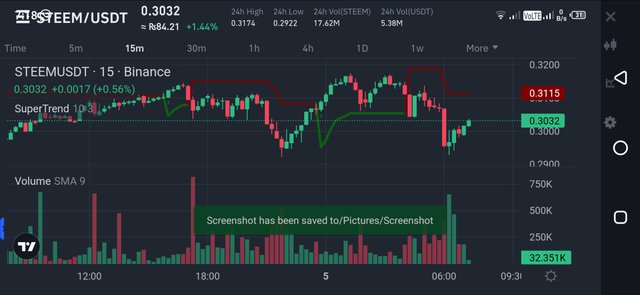
Market cycles can be very dynamic – and with the fluctuation in volatility sometimes it becomes very difficult to analyse trends as well as reversals. There has been growing adoption of strategies and systems used by traders and analysts in their decision making system. One of them is the multiple timeframe analysis, which helps the trader get more information on the market as seen in multiple time frames. I am going to show how MTFA works in different phases of the market cycle with the examples of the Steem/USDT chart.
Don’t know what Multi-Timeframe Analysis actually is?
Multi time frame analysis is the technique of analyzing prices of an asset over different time intervals in an effort to discover formations of patterns, trends, or entry and exit points. For instance, a trader may use the hourly, the daily, and the weekly charts of a particular asset to look at the general trend to look at reversal points.
It is pertinent to adopt this use of time frames because the phenomenon of the market is revealed at different angles depending on the period under consideration. If you are looking at the short-term perspective of a particular stock, there could be minute oscillations in the price; but if it were a long-term perspective, there are likely to be observable trends. The advantages of this approach are that applying both perspectives can lead to a better understanding of the behaviour of the market.
Forecasting Applying Multi-Timeframe Analysis
When it comes to the actual trading of Steem and USDT, traders want to focus on time frames from the 1 hour-style chart via the daily and weekly style chart. Within this approach, it is possible to establish trends and reversals across all phases of the market cycle.
- Trends Identification
Long-term trends: With the help of the weekly chart of the Steem/USDT rate, traders can establish certain trends which demonstrate general tendency of the market. These trends are important to traders aspiring to hold long term investment since they are used to determine entry/exit points to the market.
Example: From January 2018 to January 2020 the Steem/USDT market took a bullish turn as is evident from the weekly chart. This trend was by a continually rising value of Steem relative to the US dollar. Those traders who wanted to follow this trend could have perfected taking long positions through this period.
Short-term trends: Still, the hourly charts provide more details of the short term trends that could not be seen on the daily or weekly charts. These trends can assist the trader in analysing and/or looking at the market with the view to determining the best avenues to trade.
Example: Steem/USDT market in August 2020 was very volatile and within a single day there were multiple short-term trends registered. Day traders could have profited from these trends by opening and closing lots of contracts during a day to respond to a market’s powerful fluctuations.
- Reversal Identification
Determining potential reversal points: Thus, having studied several time zones, traders can find a reversal zone within the market. These points are very crucial for the trader who wants to get in or out of the market at appropriate times.
Example: This agreed with the signal which was displayed as a potential Reversal in the Steem/USDT market as per the hourly chart in February 2021. The prices just started increasing when they were disrupted by what actually meant another swing in the market. From the daily chart, traders could have been sure that a reversal was under way and act correspondingly.
Converging trends: There is also some information about potential reversal points in case one observes the convergence of trends in different time frames. When either of the trends on various charts are the same, it may mean a huge change of the market behaviour is expected.
Example: From the analysis in this report, it was evident that the Steem/USDT market was bearish for both daily and weekly time frames as of March 2021. The given state of affairs indicated that the market was about to decline even further this trend speaking for it on these grounds. Observers could have used this information to exit the market and avoid being sack of unexpected losses.
Multiple timeframe analysis is considered to be a useful approach for those traders who work in search of emerging trends and signals of change when employing different interval segments during the different phases of a market cycle. It helps the traders to gain a better insight about the market behavior as the price evidence of faster intervals is minutely examined as compared with the cumulative hourly or daily changes. Two four and four examples from the Steem/USDT market demonstrate how the analysis of hourly, daily, and weekly charts can reveal trends, trading opportunities, and reversal points. Overall multi-timeframe analysis can be considered as one of those effective techniques that significantly contribute to gaining better performance of trades and can definitely give an edge in the market place.
Modern financial markets are not static and therefore traders continue to look for that additional edge or an efficient trading methodology. Market cycles and Multi Time Frame analysis are two analysis techniques that have been proved relevant over many years. Collectively, these tools shall help complement the existing knowledge of market behavior, facilitate better decision making processes, and consequently, aid in the formulation of better trading strategies.
In this article, let us describe how multi-timeframe analysis could be synchronized with market cycles and deal with the advantages of their unison in conditions of high volatility.
Understanding Market Cycles
Market cycles refer to the natural ebbs and flows in market price action, typically divided into four main phases:
- Accumulation: Prices are low as many market players hold long positions waiting for the price to recover.
- Markup: They do so because buying pressure is created during the accumulation phase leading to increased prices.
- Distribution: Prices are high due to active market participants who salve their positions in order to realize their profits.
- Downmark: The prices drop when selling pressure supersedes the buying pressure.
Fortunately, every cycle may differ in its length and even aggressiveness but it is still rather crucial for every trader to understand them, as these patterns will help him/her to define the entry/exit points as well as the tendencies and decide on necessary adjustments.
Utilizing the multi timeframe analysis
Multiple timeframe analysis means that a trader looks for potential trades on different timeframes available for the selected financial instrument: daily, weekly, or monthly, for instance. This method enables the trader to have a long- as well as a short-view of the marketing system. For instance, a given trader may look at the daily bar to figure out where to enter or exit a trade, yet, at the same time look at the weekly or the monthly chart to understand place of the market in the larger picture.
It does this by allowing traders to use several time frames on one chart in order to compositely read the various time frames and make better decisions for when to enter or exit sell or buy a particular security.
The next trading strategy ties the Market Cycles concept to Multi-Timeframe Analysis.
To effectively align market cycles with multi-timeframe analysis, traders can follow these steps:
Identify Market Cycles: The best way to start is to determine the numerous cycles within your chosen asset or market to trade. This process might involve paying keen attention to price action, volume, and other technical indicators in a bid to not only determine accumulation or markup phases but also distribution or downmark phases as well.
Select Appropriate Timeframes: After that, choose the most suitable time intervals for the analysis. This should be made more based on the physical characteristics of the asset and the nature of the cycles that are in the market. For instance, a larger-cap stock will need weekly and monthly time frames for optimal multi-timeframe trading, while the smaller-cap stock will need only daily and four-hour time frames.
Overlay Multiple Timeframes: With the selected timeframes superimpose the corresponding charts to visualize market cycles in different time scales. It can assist traders in spotting convergence/ divergence techniques of different time frames i.e. where different time frames point to the same area of the chart and suggest different market conditions.
Evaluate Trading Opportunities: Once the market cycles and the multiple time frame alignment have been completed, traders can now assess trading opportunities. For instance if the daily chart suggest a markup phase when the weekly chart suggests, distribution phase, then there could be a trend reversal or signal could suggest change in sentiment.
Confirm Signals: Technique: It is advisable to use other analytical tools, which may include technical indicators, price patterns or fundamental analysis to confirm the signals in order to minimize false signals and, therefore, improve trading decisions.
The interplay of market cycles and multi-framing in unstable markets
In each case, volatility complicates the analysis of market conditions, although market cycles together with multi-timeframe analysis are particularly powerful. In volatile markets, these tools can help traders:
- Filter out noise: In many-time frequency analysis, the trader can be able to eliminate unnecessary variables resulting in signal or noise by prolonging the chart period.
- Identify sustainable trends: In essence, via price action analysis across different time frames, traders is in a position to differentiate between trends and noise.
- Time entries and exits: Since we see markets unfolding in different time horizons, then this approach can help in fine-tuning of market entries and exits very well, managing risks, in general, and enhance trading success.
Conclusion
Holding the season factors and multiple time frame analysis are the perfect solutions for the traders who want to change the existing strategies and become more sensitive to the fluctuations in the market. When applied together, these techniques provide better insight into the stock market fluctuations, trading prospects, and ultimately assist traders in making better decisions.
With the help of this article, one can learn that market cycles, implemented together with the Multi-Time Frame analysis, makes it possible to analyze even the most complex and unpredictable markets with incredible efficiency and without error.
The cryptocurrency market has been considered to be highly sensitive and experiencing frequent fluctations in prices. Such tendencies help the trader, relying on highly developed patterns, to make the most of the market’s short-term fluctuations. When combining market cycle phases and multi-timeframe analysis, we are capable of achieving an incredibly powerful trading strategy for the Steem/USDT pair. This article will discuss such a strategy with reference to entry, exit, and risk management criteria.
Step 1: Market Cycle Phases
The cryptocurrency market typically goes through three major phases: the accumulation stage, the public indulgence stage, and the distributive stage. Here's a brief overview of each phase:
Accumulation phase: During this phase, the cost is cheaper, while the market attitude is rather negative. Whales and strong hands hold the cryptocurrency intending to purchase it at the current low price.
Bull market phase: At this phase, the prices start going up as more investors invest in this asset. Market optimism kicks in, and you begin to see a steep rise in the prices of stocks.
Bear market phase: This phase is characterized by massive offering to the market, high volatility and high degree of bearish sentiment. Accumulation phase mostly occurs at this time because price tending to reach its lowest before the next accumulation phase sets in.
To apply this concept to the steem/USDT trading pair, it will be important to know these phases and when they occur. For example, we tend to enter the buying area more carefully in the accumulation phase and pay more attention to the appropriate risk/ reward entries in the bull market phase.
Step 2: Multi-Timeframe Analysis
In order to build a proper trading plan we have to look at the market at different time horizons. By doing so, this enhances our ability and likelihood in pointing out the right entry and exit points. Let's look at how we can apply multi-timeframe analysis to our Steem/USDT trading strategy:
Long-term analysis (weekly chart): To achieve this we need to first analyze the overall market sentiment and rather look at any long term trends in the market. In the bull market phase we focus on the extended trends on the weekly chart whereas in a bear market phase we might be looking for reversal points.
Medium-term analysis (daily chart): Daily chart can therefore be used to determine short-term movement and support or resistance level. During a bullish phase we are therefore looking at those prices as a breakout point above the selected levels. In a bearish phase what we may look for is that there might be some sign that signal a shift into a bullish phase.
Short-term analysis (4-hour or 1-hour chart): Whereas, the short-term analysis let us first and foremost see entries based on specific thoughts on small movements in the market. It can be searched for possible swing highs and lows or we can search for a stock’s possible entries with indicator such as moving average or RSI.
Step 3: Entry Criteria
With the market cycle phases and multi-timeframe analysis in place, we can now establish our entry criteria for the Steem/USDT
Having multiple time frame knowledge of trading in today’s global market environment and business cycle is so important in trading. It is here that consistency is needed most of the time as markets go through various phases giving different opportunities and challenges.
In this article, we will look at how to avoid ‘false signals’ when multi-time frame analysis is implemented during various phases in the cycle.
Various Market Cycle Phases Explained
To successfully trade across multiple timeframes, it is crucial to understand the different market cycle phases, which generally include the following:
- Accumulation: It is in this phase that smart money starts to buy assets with the view of holding them for the short-term traders with a cheaper price.
- Markup: With increase in the accumulation more so by the market participants, prices begin to go upward due to optimism.
- Distribution: It is also important to note that while prices are at their highest market performers tend to dispose of their assets causing a reversal in price movements.
- Markdown: As localization occurs, the market begins changing direction in certain ways, providing an ideal entry point for counter-trend traders.
through such market phases traders are able to find trends and directions of the certain markets.
Risk Management Across Different Time Horizons
To effectively manage risks and avoid false signals when trading across multiple timeframes, follow these strategies:
- Develop a comprehensive trading plan:
When developing your trading plan.You need to describe your risk profile How you will enter a trade? How to exit?How much capital you are willing to allocate for each trade?Your profit taking levels. Make it clear, obviously outlined so that one does not make hasty and emotional decisions. - Use multiple timeframes for analysis: When trading, work out the prices from the different time horizons. It will assist in reveal entry and exit levels and the verification of trends while excluding various break outs.
- Apply risk management techniques: Employ other risk management practices such as the position size, stop loss and trailing stop orders. Risk can be controlled within certain parameters to prevent more loss than anticipated and to do damage-control to your trading plan.
- Implement technical analysis: It is recommended to analyze trends, use such technical indicators as moving averages, RSI, Bollinger Bands etc. This will assist you in trading decisions and exclude false signals.
- Adapt to market conditions: There is nothing permanent in any market, constant ready to adapt your approach to correspond to the general market trends. Constantly focus on events, which are taking place in the news and in the market to identify their potential influence on your trades.
Avoiding False Signals
To avoid false signals when trading across multiple timeframes, consider the following tips:
- Avoid overtrading: Volatile trades are always perilous and trading based on false signals can mean heavy losses. Rather, one should be more careful to make sure that the setup looks more like the trading plan that is being incorporate.
- Use confirmation tools: This is with other technical indicators apart from candlestick pattern, chart pattern and others before you enter in the trade.
- Be cautious during market reversals: Such possibilities bring innumerous false signals and a high likelihood of loss because of confusion. Take your time and wait a little longer holding on for a clear separation or a clue that a breakdown is imminent.
- Analyze market breadth: Comment about the current state of health of the market by tracking market breadth figures that include the advance decline line and the breadth thrust index. This will assist you in dulling out the noises that come
with the fluctuations of individual security in the market thereby giving you the right bias to determine the general trend.
Conclusion
Indeed, crossing over multiple time frames and the various phases of the cycle involve the understanding of the current conditions in the market and a good risk management warranted. This way, the risks are minimized together with false signals in the process of navigation through the current trading environment of today.



Hello friend greetings to you, hope you are doing well and good.
It seems you have good knowledge of the market. All the four phases are refined quite beautifully. Your Charts are amazing and give us too much knowledge to be gained. I believe alta coins season is starting soon and we may see a new all time high for many coins.
I wish you best of luck in the contest dear friend. Keep blessing.
Thank you so much for your words.