Crypto Academy / Season 3 / Week 7 : Homework Post for Professor @yousafharoonkhan .
Hi to all my steemian fellows . I hope you will fine by the grace of Allah Almighty . I am also fine and its my pleasure to participate in this class . And i am one of your student . I am grateful to professor @yousafhoroonkhan for this interesting lecture .
1) Defining the TradingView site and how to register an account in tradingview? what are the different registration plan?(screenshot necessary)
Tradingview helps to traders and investors to find out the trends such as direction of market . Traders and investors use to make analysis before trading or investing . It can offer the different levels of trading platform. Tradinview platform is really very popular for traders and investors due to its unique properties. It has very important tools . These tools helps to traders for the technical and fundamental analysis . The users use these tools and indicators in conducting technical analysis .
How to Register
Now we can see all the steps that how to register on the tradingview . It is really very easy .
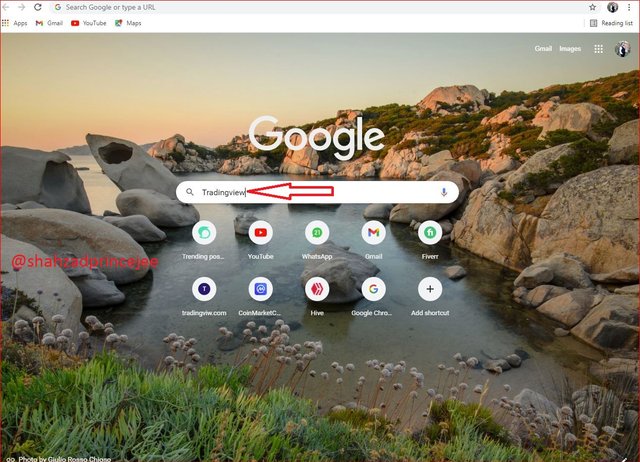
First of all , we have to use the seach engine such as Google . We will use the Google search engine to know the official website of tradingview . Now will search the Tradingview on the search box of the Google . Now you can see in the below image .
Within few seconds , a new page will show on ou display . We select only the first result which is seen in the below image .
Now we click on the start free trial which is available at the left side of the page .
After few seconds of loading , the page will be show the different plans . But we are starting as new beginner because we want to using this interesting platform . We should not choose any of plan in which we will pay .
When we scroll down , we see the try free basic . We just click on it .
And now the next page will demand from us that how we want to signup . It will give us different options such as Email , facebook, yahoo and twitter etc . But i am going to choose the email .
After click on the email option . We will put the email address and password to create a account . Click on the i agree to term and click on the box of captcha and now click on create account.
Now the new page will show that we are closer to the account active . Now we click on the Resend activation link.
Now will go on the email to click on the create account in the message tradingview which is sent to our email. Now we will just put the first and last name and put the photo and click on the continue .
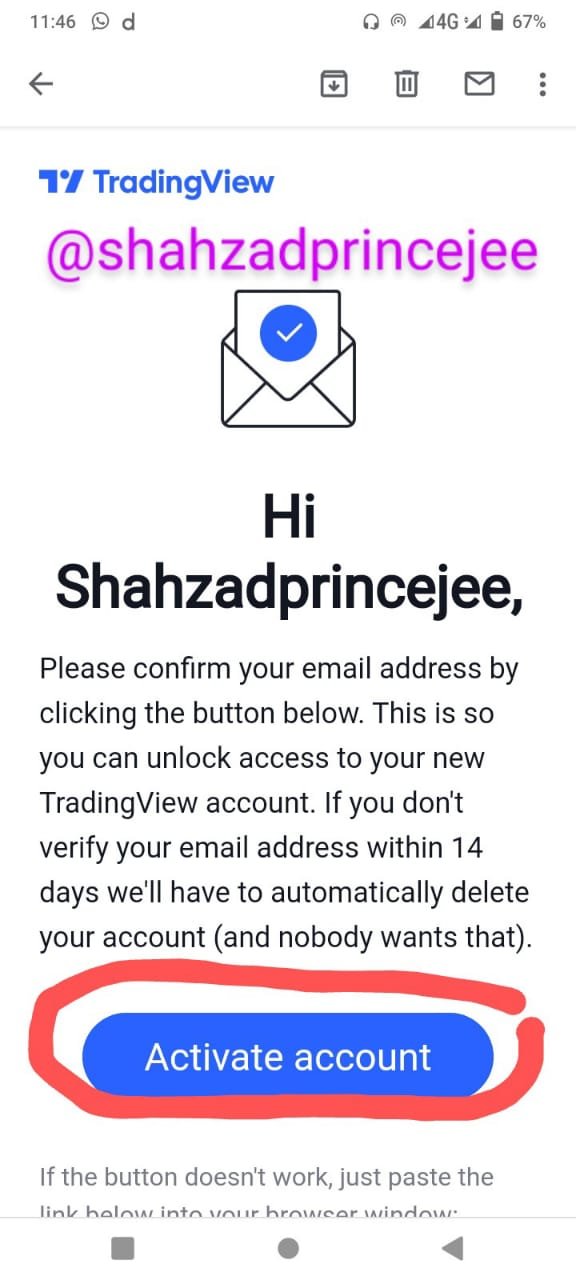
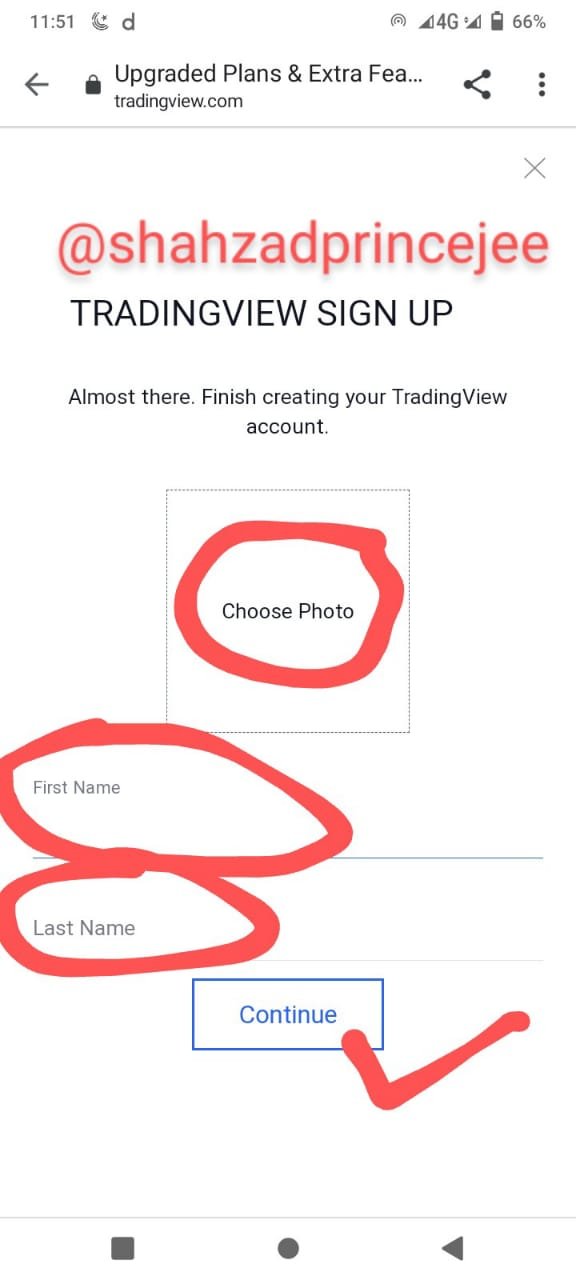
Now we can see at the left side of the page that we successfully activate the account . We can see the S in the image below .
Different registration Plan
Free Basic Plan
Pro
Pro+
Premium
Let's see the image below about the above plans .
We can see the red rectangle of above box . There are three plans which we will explain now .
Free Basic Plan
In this free basic plan , we can use only three indicators and see only one chart . It is mostly used by those people who are learning about trading and analysis still . In this plan , a user can't access some tools . Because it has not advanced tools , they always use this plan to predict the prices of different products and is always pop-up a notifications of advert on the chart .
Pro Plan
In this plan , we can use only five indicators and see the only two charts . Those users who are using this plan they have access on some extra tools than the free basic plan user's . They have access on the advanced tools for their tradings and technical analysis . There is no distraction on this chart . It stands on the $14 per month price and there is no pop-up notifications of advert which are come when the user doing analysis . It can always avoid ads .
Pro+ Plan
In this plan , user can use maximum ten and four charts help to user . It also stands at $29 per month price and it gives the more benefits than Pro plan . Most of users always use this plan to get the more access to tools for technical analysis than Pro .
Premium
The experienced and expert traders always use this plan . Because this is really very expressive . The user can use the maximum 25 indicators and support eight graphic charts . It stands at $59 per month price . In this plan , the users go on to any frame time . From this plan , the user can do many things which the other plans not offer to their users . The users can set many of alerts which notify them .
Question2 : Explain the different features of tradingView and what is your favorite feature and why (screenshot necessary)
These features are very important and all features have different functions . Now we will explain all the below features .
Chart
Trade
Market
Screener
Community
More
Chart
It is really very important feature of tradingview . Most of users use it for conducting the technical analysis . This chart is happen where the the users can modify their analysis and trend lines . On the chart , traders do many of their activities on tradingview .
Trade
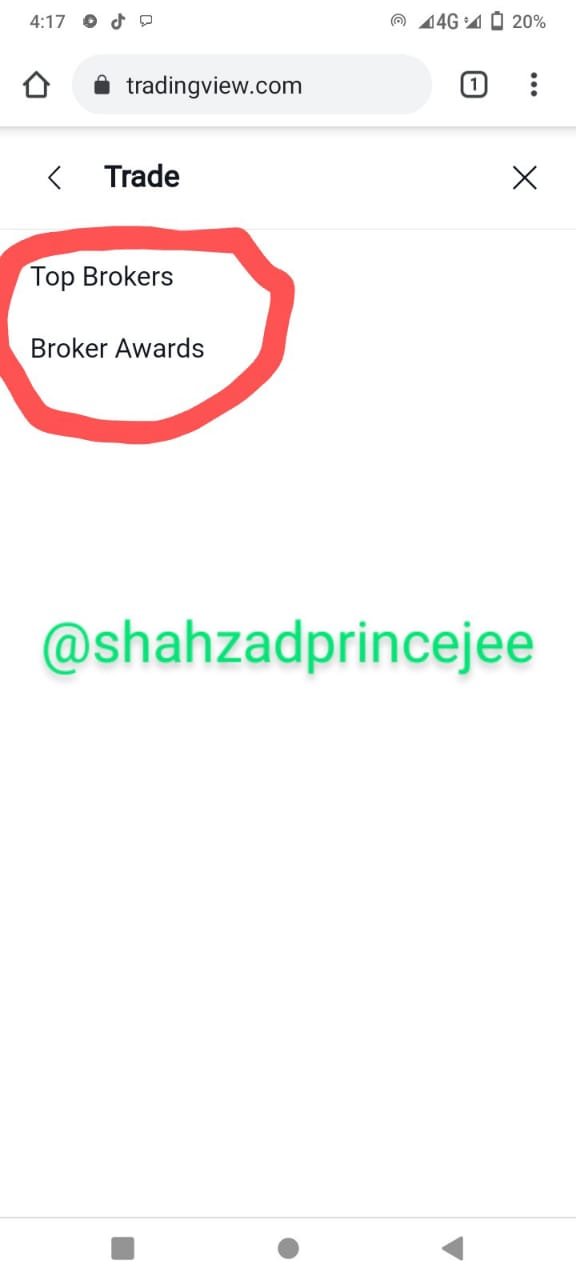
As you can see in the above picture about the trader feature . We can see it shows the two options which are broker awards and top brokers . From this , traders trader their assets at their favourite platforms. The brokers provie the facility to the traders with latest new by both investors and traders . The brokers are the partner of the tradingview .
Market
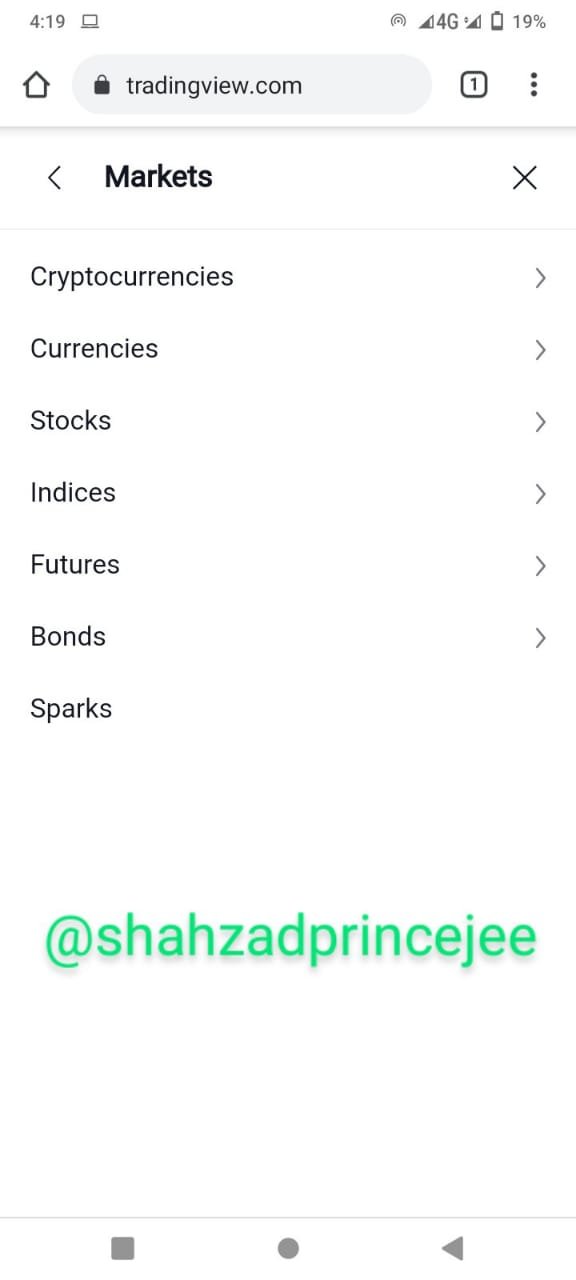
In the economic trading , there are many kinds of markets . It is based on the types of assets . As we can see in the below picture when we click on the market option , we can see the different features of this feature . Such as Stock , Currencies and fortune etc .
Screener
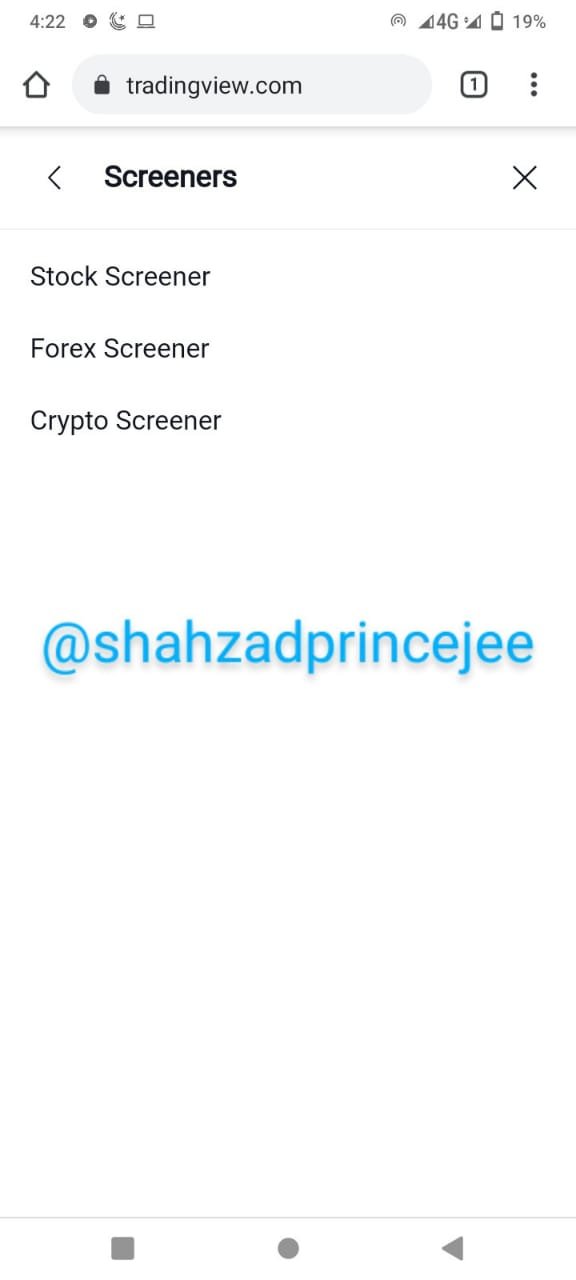
This is an interesting feature of trading view . It offers us three kinds of screeners such as Stock , forex and the crypto Screeners etc . From the screening , the trader estimate their assets that which is the best for his to trade .
Community
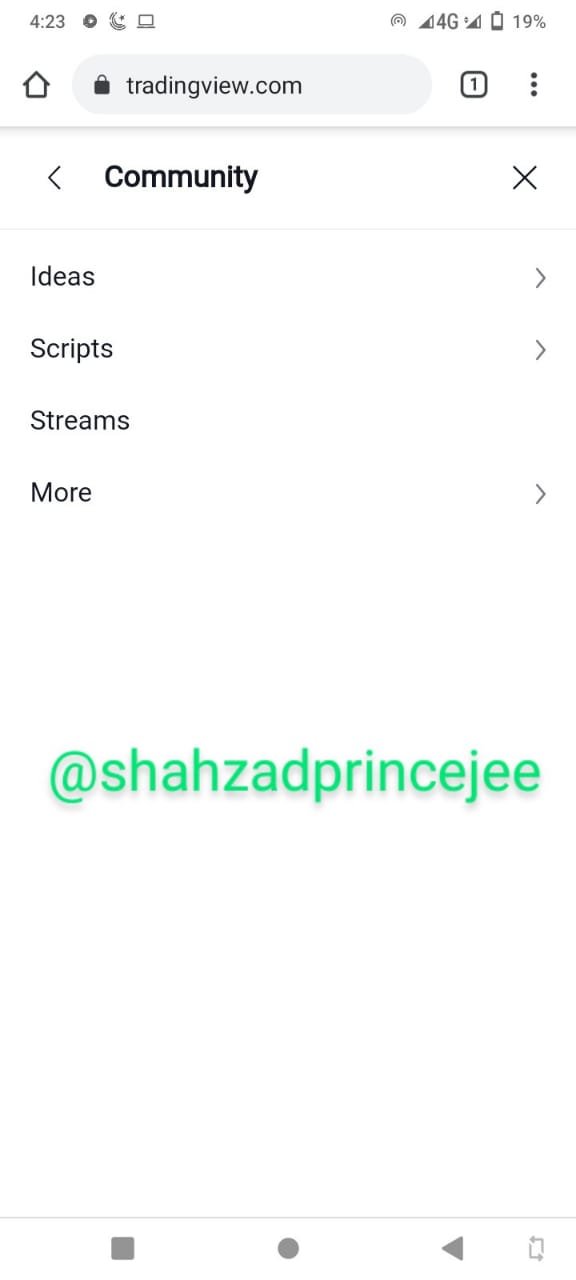
In this feature , we can see many of things such as script , streams , ideas and so many other. From this feature traders can interact with each other . We can find out the thing like trends , moving averages and so on .
My favourite Feature
My favorite feature is Chart feature . It is really very important feature of trading view . From this feature , we can determine the time . It has many of properties . By using this feature , We can be able to conducting the technical and trading analysis . We can see the all trends by using this feature .
Question 3) How to set up a chart in TradingView and use two tools to edit it.(screenshot necessary)
Click on the chart feature to set up the chart .
When we click on the chart , a new page will be open on our display . There are many of things which can help to the traders for technical and trading analysis . In the left side of the chart , we can see the tools such as horizontal lines , trend lines , long positions and measuring tools etc . In the other hand , the prices tools are available and other watchlist , calendar and other so many things . At the top of the chart , we can see the many of important which are replay , time frame and setting etc . And the botton show the time and date . We can see in the below image .
First of all, we should be click on the setting which available at the almost left side of the page .
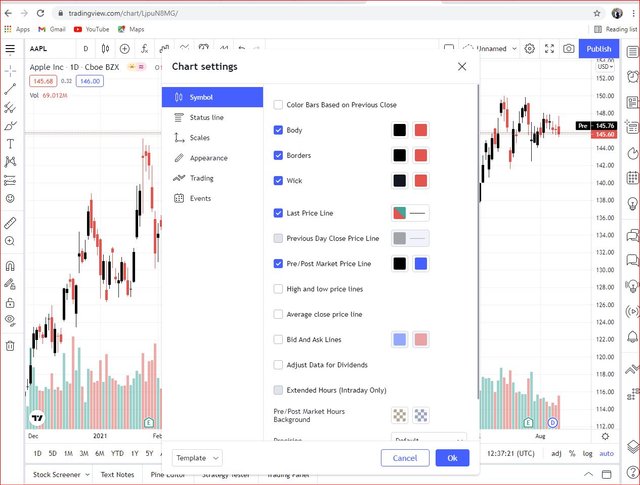
After clicking on the setting option . A page will be opened on our display . Now i can choose from this that which will suit to us from this colour spectrum as we can see in the below image .
In the setting , a status option is available where we will see, High , "Close and Low (OHCLE)", show open market status and bar change values etc . We can select and un-select from them . It depends on that what we want to see in our chart .
In this property we will select or un-select some features e.g. No overlaping labels , bid and ask labels , indicator name label and plus button etc .
Appearance is the option which can help for the appearance of the chart look like . As you can see in the below image the different properties such as horizontal grid line , background , scales text , scales line , session breaks and crosshair etc .
Trading is really very good property where we set the all setting like " Show orders , show exuction , show sell/buy button and extend lines left etc . We can set all the above things which we want to set .
Some tools can be seen at the left side of the chart . The users use these tools to do technical analysis on the chart .
4) Explain how to add indicator in chart, what is your your favorite indicator and why?(screenshot necessary)
First of all , if we want to add the indicators , click on the option of fx indicator which is at the top of the chart .
A pop up notification will be show in the fron of us with a search box for the indicators . Now we should be type the name of indicator which we want to choose .
Now we will type the name of indicator which is Relative strength Index.
Now we can see that the RSI indicator has been added to the chart . We can see in the below image .
My favorite indicator
I most like the indicator is "Relative Strength Index" . As i shown that how to add the indicators . Many of indicators are available at the tradingview but it is better than other . The reason is that it moves with the price . Generally , it shows that where the price goin on .
It is also use to know about the seller of oversold and overbought . Many of users used to know about the divergence both the bullish divergence and the bearish divergence .
It is really very easy to read . It has three bands and only a single which can help to new traders . RSI is really very easy to use than other many of indicators . Now i want to explain in the easy way for the new users . The higher band is 70 ( b/w 70 and 100 , price is overbought ) and the middle band is only 50 ( equilbrium state ) and the botton band is 30 ( between 30 and 1 , the price is oversold ) .
5) Do you think TradingView is useful in predicting the market for cryptocurrency (trend / price)?
Yes! Of course , i realized that it is really very interesting and it is useful to predict any market . As you know , i have explanined in the above explanation different markets in the trading view feature .
First of it is easy to use for any trader , learner and investor . In this tradingview , technical tools are used to predict the trend and price of the crypto assets . Tradingview has many of technical indicators such as " Vortex indicators , Relative Strength Index Indicators , moving averages and so many others . As we can see in the above screenshots that many of tools are available on the trading view such as drawing tool , trendline tool , path line and many of other which we have seen .
I realized that it is really very important for the advanced and amature active traders and investors . We can see the trends and prices of assets at any time .
Conclusion
First of all , i did not know that how to create an account at the tradingview. From this lecture , i have learnt that how to create an account for the tradingview . Excent this , i have learnt that various plans of the registration . It is quite easy to use and have the unique features . I have learnt that how can we add the different indicators on this platform . It is very sociable and unique in features .
Thanks a lot the professor @yousafharoonkhan for this amazing lecture . I am grateful to you .
Cc.
Best Regards






Respected first thank you very much for taking interest in SteemitCryptoAcademy
Season 3 | intermediate course class week 7
thank you very much for taking interest in this class
I am glad to see my result . Thank you so much professor for review my post .