Crypto Academy Season 03 - Week 08 || Homework post for [ cryptokraze ] Advanced Course - Trading Sharkfin Pattern
Hello everyone !! I hope you all are fine and having a good day. So this i week 08 of this season and i am glad that this academy is constantly helping us to learn more and more. So as you may have fetched from the heading today i am here to make my homework post for sir @cryptokraze after learning from his very informative lecture.

1. What is your understanding of Sharkfin Patterns? Give Examples (Clear Charts Needed)
In simple words SharkFin pattern can be simply defined as the sudden reversal of any trend that graphically appears to be in v shape .This reversal could be from positive market moment to negative (it will form above the mean line ) or it could be in negative market moment (it will be below the mean line ). So it can be observed easily due to its V recognition.
So from the above explaination we can say that it is effective as much as others and can be helpful. It works by just noticing the variations in market and is noticeable due to its appearing shape. Now let's try to notice it in charts.

Screenshot from tradingview.com
In the above chart in which the graph of DoG is shown and it is very easy to tell the SharkFin pattern on reversals and I have mentioned the two prominent V points on the chart.
In the first pattern on the upper left side the SharkFin pattern is noticed at bullish trend reversal and the red tiles suddenly appeared that lead to the downward trend making a v reversal and in the second pattern the reversals was in bearish trend where the tiles suddenly started appearing green and made a v shaped reversal. Lets examine another chart for clarification.

In the above graph of Ethereum we can see that how the trends appeared due to variation in market. So these variations leads to change in trend and make reversals. But it is important to mention that for confirmation of a signal to make our decisions for trading we should use additional indicators for confirmation.

2. Implement RSI indicator to spot sharkfin patterns. (Clear Charts Needed)
As i told above we often need to add indicators to confirm the specific signal and to avoid any kind of misunderstanding. Here, as explained by professor we need to attach RSI indicator for our clarifications. So let me explain how add it at first.
🔶 How to add RSi indicator to chart :
It is very easy to attach any indicator to chart . You just need to follow few steps. Here i am attaching it on tradingview.com but you can chose any.
First if all you need to click on Indicators icon ;

Then there will be a number of indicators appear and you can search for your desired indicator to be attached ;

Now the indicator is added but you should confirm some settings like the length , scale and visibility . They are set according to your need .

Now the indicator will be appeared just below the graph according to your desired settings ;

🔶Spot SharkFin patterns with RSI indicator ;
You can easily spot the SharkFin pattern using RSI indicator. It needs only simple observation on the pattern of variation and you can tell all about the SharkFin reversals.
Here i am attaching a graph in which i have circled the SharkFin pattern reversals with same colour on both chart and indicator for a single reversal.

In the above screenshot you can see that i have circled 3 SharkFin patterns just by looking at their curves. Two of them are bullish reversals and one is bearish reversal.
Now let's have a look at another chart for more observation of these patterns.

Here in above graph you can vitness three SharkFin patterns that i have marked. There are more but i have marked three for clarification of picture easily.
So this is how we can spot these patterns easily by looking at curves and using RSI indicator. I hope you understood it.
3. Write the trade entry and exit criteria to trade sharkfin pattern (Clear Charts Needed)
After learning from the lecture give by sir, It is very easy for me to explain about trade entry and exit criteria. So, let's explain both the criteria's one by one ;
⭕ Trade entry Criteria :
As did by profy we will also explain trade entry Criteria for both buy and sell positions.
🔶Entry Criteria for Buy position :
The strategy is very simple you just need to keep some points in your mind and some observation.
⚫ First of all on your chart , you should be observing for a abrupt V shaped pattern of reversal because we are considering SharkFin pattern.
⚫ For buying position you need to look for the spike where it had gone below 30 on the scale and then it makes and upward reversal by making a V shaped trend.
⚫ Before making your buy, please make it sure that the the indicator has gone above 30 on its scale.
⚫ I am attaching a graph where i have clarified it visually.

🔶 Entry Criteria for Sell Position :
This also includes almost same points like above but inversely. Let me tell you how ?
⚫ First of all obviously, you need to look for a V shaped reversal as you are using SharkFin pattern.
⚫ For sell position you need to look for when the RSI has gone above 70 level and then make a reverse towards down while making a V shaped pattern.
⚫ You should make it sure that it has crossed the 70 level towards below before finally making you sell.
⚫ So when it has clearly crossed the 70 level towards downward you can place your sell.

⭕ Trade Exit Criteria :
Just like we did in entry Criteria here we will again discuss exit criteria for both Buy and sell positions.so let's begin ;
🔶 Exit Criteria for Buy position :
It needs some observation and technical analysis and I'll explain them for you.
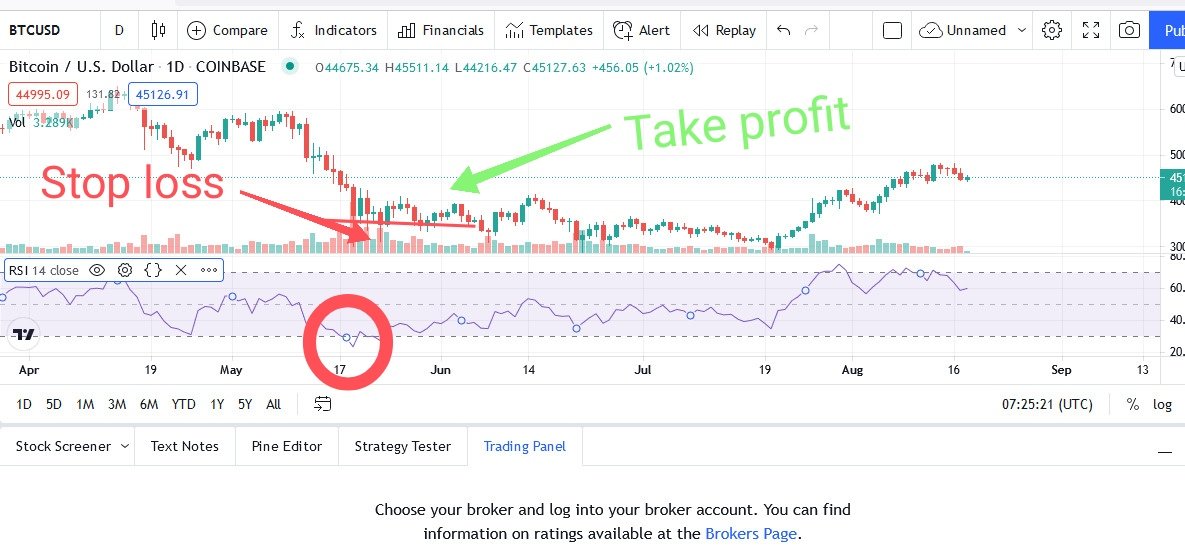
⚫ I hope you are familiar with term stop loss . In here first of all we need to set a stop loss level in case of anything happen against our expectations.
⚫ While setting your stop loss make it sure that its is kept below your Lowest swing of SharkFin pattern.
⚫ When you notice that the value of your assets is crossing the stop loss , it shows that your trade setup has gone wrong so you need to wait for another chance.
⚫ There is a term in Take profit named as risk to reward ratio. Which actually means that how much return you set with how much units of risk you involve.
⚫ Here i agree to professor that ut should be 1:1 RR because in it the overall profit has to be 50% in set trend.
⚫ So with above settings and observations when you see that it has reached your profit level you can make an exit.
🔶 Exit Criteria for Sell position :
Here the all above terms are used but in a different way as it is for sell position.
⚫ Similarly like above we need to set up a stop loss to avoid the situation if things go in unpredicted way
⚫ Inverse to above , here your stop loss should be above the high swing of your pattern.
⚫ If the price crosses over the stop loss it means that your trade has gone wrong and its time to exit and wait for another chance.
⚫ Take profit can be set according to your own desire.
⚫ Take profit level of 1:1 RR is recommended because here like i explained above the return reward is more then 50% if the trade goes in favourable condition.

So, it was all about trade entry and exit criteria. I hope you all understood it well.
4 - Place at least 2 trades based on sharkfin pattern strategy (Need to actually place trades in demo account along with Clear Charts)
Keeping all of above analysis and observations regarding SharkFin pattern it very easy to trade using SharkFin patterns.
I used Ftx pro to make trades. I basically kept the basic observation and pattern of sharkfin.
Trade 1 :
I chosed Dodg-perp pair for trade. One day frame was complex and to crossing so i chosed one day frame for trade . I made entry when the pattern was going upward. It was not a perfect entry point as it wasn't at 30 below or at buy i made decisions to according to current situation.

🔸Declaration of profit/loss :
Price at my entry : 0.28 USD
My trade volume : 18
T. Investment = 5.04 USD
Price at exit = 0.33
T.earning = 5.94
Profit = total earning - investment = 0.9 USD
trade 2 :
Here i also made a trade using SharkFin pattern and in this trade i chosed LTC/USDT pair for my trade. I made some observations and then chosed a point where to trade ;

Price at my entry : 168 USD
Volume = 1
Price at my exit = 172.2 USD
Profit = 172 - 168.2 = 4.2 USD
So this is how i made this trade using SharkFin pattern.
🔺 The trade is for demo and is virtual.
🔺 All the screenshots belong to me and taken from tradingview.com and ftx pro.
Conclusion :
From all of above discussion it can be concluded that SharkFin pattern is an amazing pattern to track reversals and make trade decisions. The RSI indicator should be added for confirmation of signal or trend and for clarification. The SharkFin pattern which is V shaped could be either of bullish trend reversal or bearish trend reversal. When making a buy decision one should be sure about it is below 30 and just crossed it to above and for sell decision it should be cleared that it was plus 70 and just crossed it towards below. So these observations can tell you about entry and exit strategy of trades and keep them all in mind before making a decision.
Thank you so much for reading. I tried my best to answer all of the questions accordingly and to the point. I hope i get good grades 😇.
🔶 Submitted to :
🔶 Submitted by :
