Trading using Fibonacci Retracement Levels
|
|---|
Hope you all are doing well and good and enjoying the best days of your life. This is me @shahid2030 from Pakistan and you are here reading my post. You all are welcome here from the core of my heart.

This is my participation in a contest Trading using Fibonacci Retracement Levels organized in SteemitCryptoAcademy by @crypto-academy.
Explain the concept of Fibonacci retracement as a technical analysis tool and how it is applied in crypto markets. |
|---|
Fibonacci retracement is a technical analysis tool traders use it for finding the price action of the commodity. It can be used in every trading platform, stock exchange, Crypto, Forex and many other.
The concept behind Fibonacci retracement is very simple. Their is a simple calculation for it. We add two numbers, get a result and then add the upcoming number to that result. Let me show you through example. We have digits like 0,1,2,3,4,5,6.... so on. Now we will add these like, 0+1=1, 1+1=1, 1+2=3, 3+2=5, 5+3=8, 8+5=13, 13+8=21, 21+13=34, 34+21= 55, 34+55= 89 .... and so on.**
Now I will tell you the procedure how to bring out the Fibonacci retracement level. It's too much easier too. For example we get 55 number. 55÷55=1, 34÷55=0.618, 21÷55=0.3818, 13÷55=0.23. You can apply this formula on every three digits to give you the precious golden Fibonacci Level.
How to use Fibonacci retracement Tool?
I have shown how Fibonacci retracement mechanism works, now I will tell you how we can use it for our own technical analysis. We have different retracement levels of Fibonacci, but the most important one are the golden Fibonacci retracement level. Golden levels are 0.38, 0.5 and 0.618. These are the strong retracement levels in Fibonacci and we can expect the market can go back in trend's direction.
Fibonacci tool give us two important indications; one is of retracement and the other is of trend reversel. If the the retracement levels get fail, it's a sign of trend reversel for us
Utilize Tradingview to illustrate Fibonacci retracement levels on the BTC/USDT, ETH/USDT, and STEEM/USDT pairs. (Include screenshots to showcase retracement levels during both uptrends and downtrends). |
|---|

Fibonacci retracement levels on the BTC/USDT
This is Bitcoin chart on 15 minutes time frame. Let me explain the important levels of Fibonacci on this chart. You can see BTC is in uptrend now. Here you can see the golden levels of 0.61 and 0.5 are highly respected by the price. At a point we have seen a correction or retracement the price has came blow 0.61 level, but soon it take a huge raise in BTC price.
We can see at that point it was a perfect example of retracement. The price came down and then it raises in a steep way. No the price is trading above 0.23 level and we can say that, the BTC is an uptrend now.

Fibonacci retracement levels on the ETH/USDT
This is ETH/USDT chart on one hour time frame. ETH is in uptrend currently. A price went up from Level 1 and cross 0.61 level. From that point we see a retracement in the price and the price went down and crossed 0.78 level. After the retracement the price goes in a huge up rally. It has crossed the golden level of 0.38, even 0.23 level is crossed.
The price is continuing it's trend, ETH is still in uptrend. If it reject from.the extreme level, and make retracement, then it will be a perfect time for us to take entry for long at the golden levels.

Fibonacci retracement levels on the STEEM/USDT
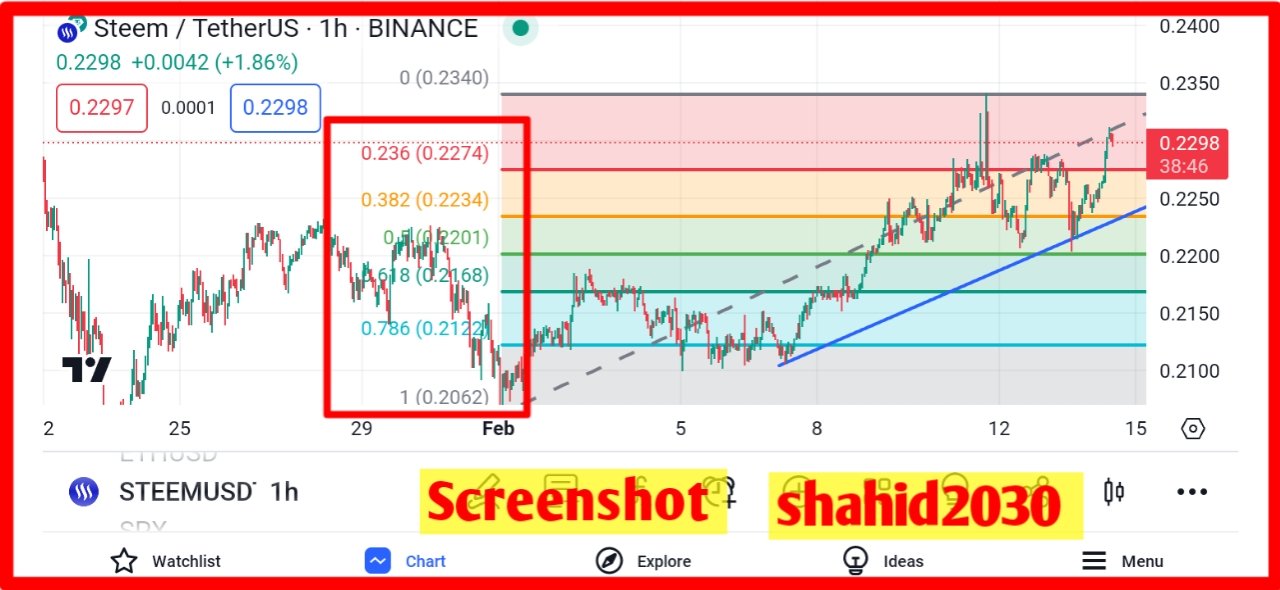
This is STEEM analysis using Fibonacci tool on 15 minutes time frame. The price of STEEM is in uptrend here. We see a straight up raise in Steem price, The a perfect retracement took place. It has crossed all the golden levels of Fibonacci. At 0.61 level we see the price ranged too much, many times it tried to give a break through, through down side, but failed. From that point (0.61 level) we see a huge raise in Steem price.
Break down the significance of key Fibonacci levels (e.g., 0.382, 0.500, 0.618) and explain how traders interpret these levels for potential support and resistance areas. |
|---|
0.382, 0.500, 0.618 are the important levels in Fibonacci. We call these the golden levels of Fibonacci. Most of the time I give us the retracement in the price of commodity. It may be both in upward and downward trend.
Let me explain it through example This is the chart of STEEM/USDT I have used it above. Here you can see the price of steem goes up. It has broken all the golden levels in above position. It has made a higher high. Then we can see a correction in the price. It's mostly happen that our correction or retracement levels are respected after a raise or dump in the price. Now we can see the price retracted back, the 0.618 level is respected and the price went back to the moon. The is the perfect example of retracement in uptrend.
The support and resistance concept in Fibonacci retracement are too much easy. For example the price is trading above 0.61 level and below 0.5 level, we can say that 0.61 is our Support and 0.5 is our Resistance. The same we can apply for any level. We can see in the chart above, 0.618 is acting as a strong support level, because many attempts has been made to break it. The Golden level 0.38 act as a strong resistance level as many attempts made by the price to break it. Finally we can see it has broken through upside.
Explore the synergy of Fibonacci retracement with other technical indicators (e.g., Moving Averages, RSI). Discuss how a combination of tools can provide a more robust analysis. |
|---|


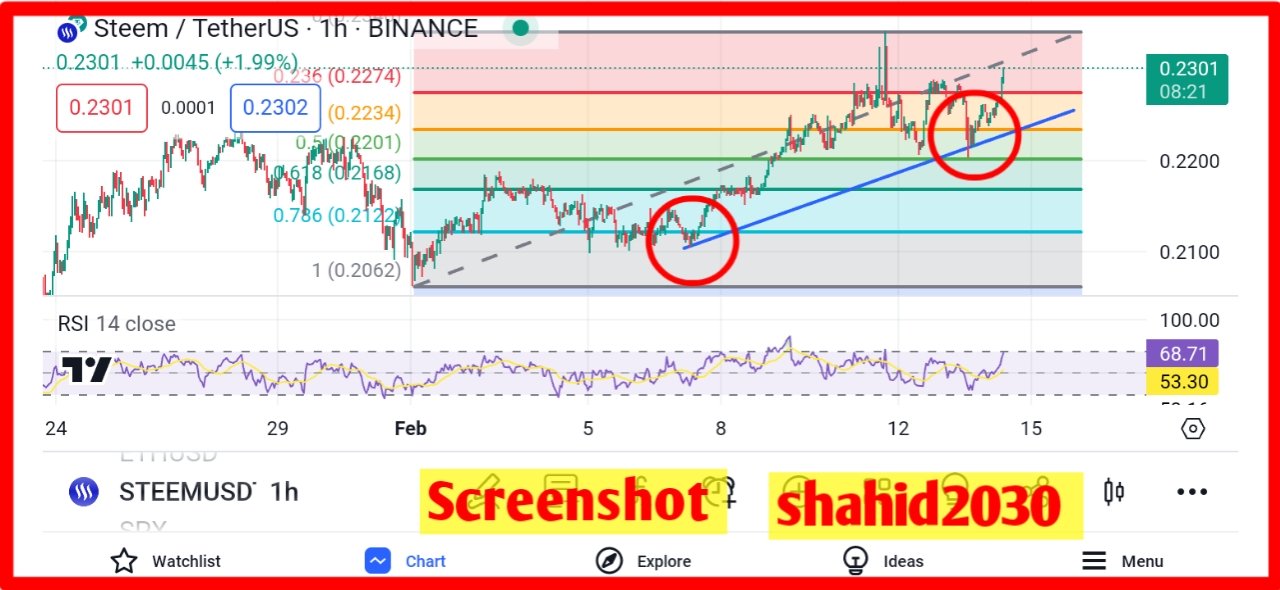
I have used Fibonacci on STEEM/USDT Pair. Along with it I have used Trend line plus RSI. Currently the STEEM is an upward trend on 15 minutes time frame. I feel we can see retracement in the price of steem.
Ofcourse using of tools alone is too much risky, We should use them in combination. Whenever we get multiple confirmation we should then go for short or long position. This is the basic rule of crypto trading that analysis tools should be used in combination.
Fibonacci along with MACD also shows us we are in uptrend, but their is chances of little retracement from point. The green line has made a very steep up move, which shows it can come a little down from that point.
Specifically analyze the recent price action of STEEM/USDT using Fibonacci retracement. |
|---|
Here some important zones are made. First is at the beginning of the Trend line. We are important level of 0.78. It follows the trend and make 0.78 a support line. Then another important point is 0.5 level, there the trend line is also touched so it's too much conformed that the price will go upward.
But currently the situation looks that Steem Mai take a correction. We may see a retracement in the price of STEEM COIN. First reason is, because our golden levels are below, the price may comes down to our golden levels of Fibonacci. Second reason is RSI is showing that the market is in over bought range. I think STEEM come down from 0.2272 range to 0.21 and these areas.
This is all about my blog for today, hope you guys have enjoyed reading it. See you soon with a new amazing and interesting topic, till take care.

| I would like to invite: @goodybest, @ripon0630 @emsonic, @miyexi, @kouba01, @mile16, @pelon53 @solaymann @waterjoe , @willmer1988, @msharif to participate in this Contest |
|---|
Your presence here means alot
Thanks for being here
Regard shahid2030

This analysis of Fibonacci retracement levels in the cryptocurrency pairs' chart provides a clear demonstration of how traders can use technical analysis tools effectively. Nice entry!
Thank you so much dear friend for your precious response. Keep blessing dear friend.
Upvoted. Thank You for sending some of your rewards to @null. It will make Steem stronger.
Thank you for the upvote too.
Well explained brother your breakdown of Fibonacci retracement and its application in various trading platforms, including crypto is clear and easy to follow. I appreciate the simple examples you provided to illustrate the concept. Keep up the great work..
Thank you soq much dear for your precious comment. Keep blessing.
Thank you, friend!


I'm @steem.history, who is steem witness.
Thank you for witnessvoting for me.
please click it!
(Go to https://steemit.com/~witnesses and type fbslo at the bottom of the page)
The weight is reduced because of the lack of Voting Power. If you vote for me as a witness, you can get my little vote.
You explanation of Fibonacci retracements, has shown to me that you have a good understanding in trading the financial markets. The analysis you have shared with us a good for which I can tell you that anyone who come across your post will find it very useful. Success to you.
Thank you so much dear friend for your precious comment.. keep blessing dear.
Fibonacci retracement levels can be useful tools for identifying potential support and resistance levels in trading, aiding in decision-making and risk management. traders can enhance their technical analysis strategies and potentially increase their probability of successful trades. Best of luck to you.
Yes dear Fibonacci retracement levels are of too much importance and most of the time it gives us accurate data. Thank you so much for your precious comment. Keep blessing.
You should also participate in such contest, I hope you can write well.
Thankyou for supporting me In sha Allah i will write on it soon.
My participation link.
https://twitter.com/Shahid00116/status/1757787747203404070?s=19
Assalamualaikum @shahid2030 Your detailed explanation of Fibonacci retracement is truly enlightening especially for those diving into crypto trading. The examples with Tradingview screenshots add a practical touch making it easier to grasp. Your analysis of BTC/USDT ETH/USDT and STEEM/USDT pairs showcases the versatility of Fibonacci levels. Combining it with other indicators like RSI and trend lines demonstrates a robust approach. Best of luck
Happy to see your positive comment under my post. Keep blessing dear friend.
It's really very simple matter just understand where you need to use it and how to use it then no more problem presented very nicely your retracement levels are really visible traders are benefiting a lot by using these tools
Thank you so much friend your precious comment means alot to me. Keep blessing.