Steemit Crypto Academy Contest / S15W4 – Cruce de la Muerte Vs Cruce Dorado.
|
|---|
Hope you all are doing well and good and enjoying the best days of your life. This is me @shahid2030 from Pakistan and you are here reading my post. You all are welcome here from the core of my heart.

This is my participation in a contest Death Cross Vs Golden Cross organized in SteemitCryptoAcademy by @crypto-academy.
1.- Explain in your own words, what is the golden crossing and what is the crossing of death? |
|---|
These are the two simple phenomen we use in technical analysis to predict the future price of a crypto currencies, Forex or stock market's commodity. We We use two Simple Moving averages for it. Keep the length of one moving average at length of 50 and that of other at 200. Actually here the figures show the number of days, 50 figure mean fifty days, and 200 figure means two hundred days.
what is a golden cross?
Golden Cross is made when 50 days moving average move towards 200 days moving average and cross it. As the name indicates that it's a golden opportunity for the investors to buy or go for long. This is a bulish signal and it's mean the price from here will goes up now.
what is a crossing of death?
Death cross is the opposite to golden cross. Here the 50 days moving average cross the 200 days moving and goes down. This shows that the price of the commodity (crypto, forex or stock) will goes down. Here we have a buy signal.
2.- Use the BTC/USDT pair to show the golden crossover and the crossover of death, in tradingview. Also use the STEEM/USDT pair to show the golden cross and the death cross. Screenshots are required. |
|---|
It's too much simple to find out golden crossover or death crossover. We can find it for any crypto Pair. **Simply go to trading view, search SMA and select 10 in length option. Then search again SMA and put 200 in length option.
Let me first show you Golden crossover through BTC/USDT Pair.
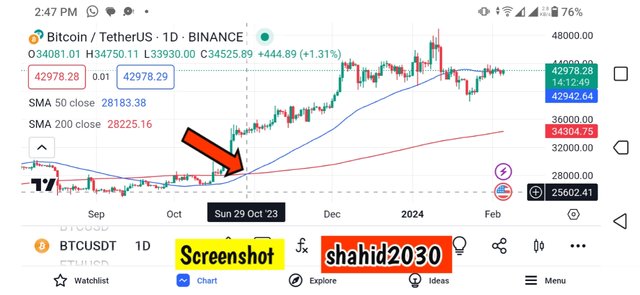
Here you can see a golden crossover that happened on 29 October 2023. The 50 days SMA cross the line of 200 days SMA on upside direction. You can see very clearly from that position a huge raise in market is seen. BTC price at that time was $34k, currently it's trading on $42.7k.
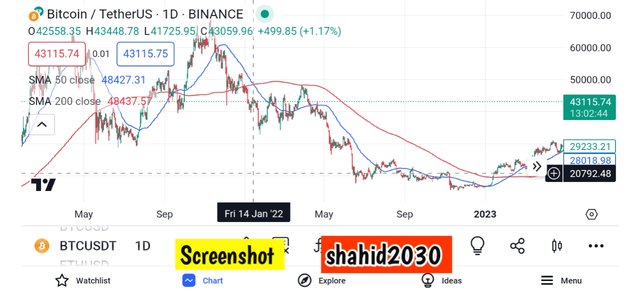
Death crossover on BTC/USDT Pair.
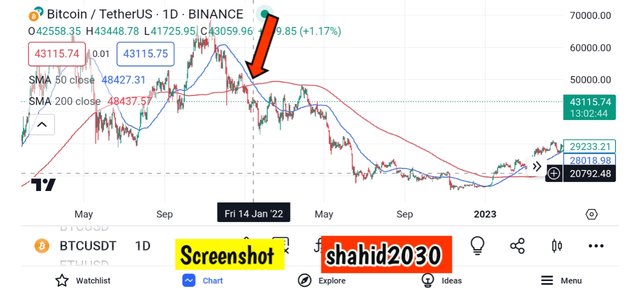
This is the chart of Death crossover, which shows the down trend. Here you can see the green line (50 days SMA) has crossed red line (200 days SMA) in downward direction, showing us the Price will go down. We see a Death crossover at 14 jan 2022, market took a huge dump from that point.
Golden crossover and Death Crossover for STEEM/USDT Pair.
Golden crossover for STEEM/USDT Pair.
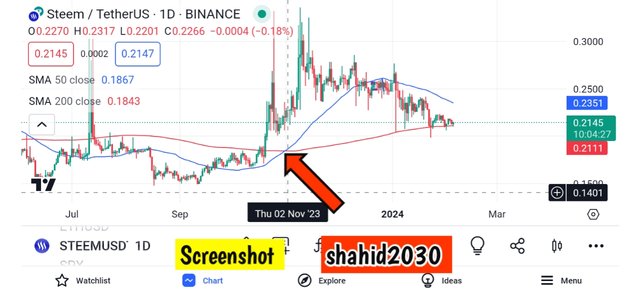
This is STEEM/USDT Pair. Here you can see the the 50 days SMA line has crossed 200 Days SMA line in upward direction.It shows a golden cross over, which indicates the market will goes in upward direction now. This is 2nd November march 2023 chart. From that day onward we have seen a bulish move in Steem price.
Death crossover for STEEM/USDT Pair.
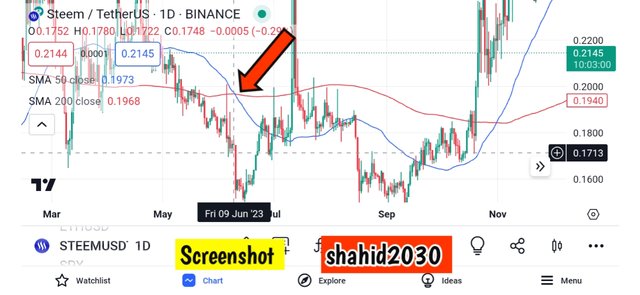
Death Crossover is for lower Trend. It is made when 50 SMA line cross 200 SMA line in downward direction. It indicates a selling signal, we should sell our commodity here. This chart is of Steem on 9 June 2023. we can see a dump in the price of STEEM.
3.- What is the difference between the golden crossover and the death crossover? |
|---|
| Golden crossover | Death Crossover |
|---|---|
| It is made when the 50 days SMA cross the line of 200 days SMA on upside direction | This is made when the 50 days SMA cross the line of 200 days SMA on downward direction. |
| It shows the market will go up. | It shows the bearish or down trend of the market. |
| It gives us a buying signal. | It gives a selling signal to us. |
4.- In addition to these two chartist patterns, what other indicator would you add to make the technical analysis more effective at the moment of taking a decision. |
|---|
Yes, I believe while taking any position in the crypto market we should do a lot of confirmation from many technical indicators. We should watch for the fundamental news too. Depending on one inductor may put us in trouble. At least we have minimum 3 confirmation before taking any position.
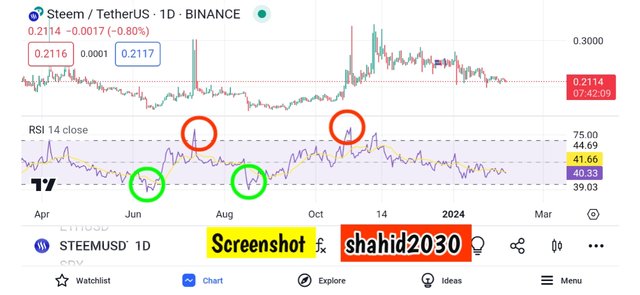
I have too many favorite indicators here in trading view, but my most favorite and the easiest one for me, which must of the time give accurate data to me is RSI. The is the simplest and easiest tool with too much accuracy. Let me tell you how actually it works. When RSI is above 70 Line it's mean entry for short at that time. Market has made high, now time for down move. When RSI goes blow 30 it's mean a high time for taking entry for long.
This is too much easy too in the entire trading view and I believe if you use it ren times, it will give you accurate results 8 times.
This is all about my blog for today, hope you guys have enjoyed reading it. See you soon with a new amazing and interesting topic, till take care.

| I would like to invite: : @goodybest, @ripon0630 @emsonic, @miyexi, @kouba01, @mile16, @pelon53 @solaymann @waterjoe , @willmer1988, @msharif to participate in this Contest |
|---|
Your presence here means alot
Thanks for being here
Regard shahid2030

Thank you, friend!


I'm @steem.history, who is steem witness.
Thank you for witnessvoting for me.
please click it!
(Go to https://steemit.com/~witnesses and type fbslo at the bottom of the page)
The weight is reduced because of the lack of Voting Power. If you vote for me as a witness, you can get my little vote.
My X Link.
https://twitter.com/Shahid00116/status/1754551852488962429?s=19
Upvoted. Thank You for sending some of your rewards to @null. It will make Steem stronger.
Greetings friend,
You nailed the explanation of the death cross and golden cross. You did a great job as you have shown us the BTC/USDT chart and explained where these crosses occur. The charts clearly show the golden cross and the death cross and you have also explained these chart patterns using the STEEM/USDT chart.
You mentioned the differences between the death cross and golden cross patterns, which is awesome. Not forgetting you also mentioned adding the RSI indicator to confirm the entry and gave an explanation of it. Smart move.
Overall, you've done a great job answering each question and showing your understanding. Good luck in the contest my friend, all the best.
Thank you so much dear for the kind and precious response. Keep blessing.
Well friend how are you your post is always very concise to the point and you always wrote in so much easy and simple language I must say you have better understanding of these topic whenever I read your post it makes.
You have answerd very clear the first definition of death cross and the golden cross and then the differences are completely mentioned makes your post more enhancing and then the use of chart make your post more concise.
Best of luck for your participation
Thank you so much dear for your precious comment. Keep blessing.
Your welcome thanks for blessing
Saludos amigo shahid2030, te felicito por tu buena participación y calificación, demuestra el.empeño y gran trabajo que realizas acá en la academia.
Ambos cruces se dan para darnos una señal de cambio de tendencia, pero siempre se recomienda usar otro método para corroborar la señal.
Suerte.
Thank you so much dear friend for your precious comment. Keep blessing.
It has been a pleasure reading through your post.
° you have clearly explained what death cross and golden cross is to my satisfaction. Your usage of the btc chart to explain the two chart patterns was awesome.
° you also mentioned the 3 differences between the two chart patterns which is laudable.
° Your choice of RSI as an indicator to be used in conjunction with golden cross and death cross is fantastic.
Overall. I read your post with great delight. Wishing the best in this engagement.
Thank you so much dear for your precious response. Keep blessing friend.
Greetings
My dear friend you have shared a detailed post and obviously together we got more information and grow well too.
You have given a good knowledge of death cross and golden cross, you have try to explain upto your knowledge.
Hence you describe about the BTC/USDT chart and also explained how the death cross and golden cross takes place it xan ve clearly understand by the analysis you showed us.
Overall you shared a good knowledge with us, keep it up.
Thank you so much for your precious comment dear friend. Keep blessing.
Has abordado con sabiduría y dominio el tema a través de todas la pautas del desafío.
Las medias MA50 y MA200 son patrones excelente para estudiar la tendencia futura a largo plazo. Como no son infalibles es importante usar otro indicador que como el RSI que mencionaste, es un indicador muy interesante para los traders.
Gracias por compartir, ¡Saludos y bendiciones!
Thank you dear friend, your precious comment means alot to me. Keep blessing.