SEC S18-W4 || Mastering Liquidity Levels in Trading .
Contest Link 👇
SEC S18-W4 || Mastering Liquidity Levels in Trading . I invite some of the skilled users I know to participate in this contest. "Honorable Mentions: @pea07 @radjasalman @ripon0630
 |
|---|
Trade liquidity as it applies to the trading markets is a measure of the degree of ease that characterizes trading in a given asset without causing a drastic shift in its price. High liquidity also implies that there are a lot of buyers and sellers in the market hence they are in a position to make a purchase and sell goods without much hysteria. On the other hand, low liquidity defines fewer traders’ participation and possibly, severe effects such as inflated price variations for every trade transaction implemented.
Why Liquidity Levels Are Important for Traders:
Transaction Costs: Liquidity above average results in lower transaction costs as the spreads between bid and ask prices are often less wide.
Price Impact: In liquid markets, big ticketing is not a problem since price changes little with large orders while in illiquid markets large orders will bring big changes in price.
Market Efficiency: Liquid markets are more efficient because current as well as all other informative encompassed on the asset price.
Risk Management:Of course, liquidity, which permits the free opening and closing of positions, is essential for risk management, especially during exceptional market conditions.
Tools to Identify Liquidity Levels on a Price Chart:
Volume Indicators: Thus, we have other tools as volume bars within a price indicator, with which it is possible to demonstrate where trading takes place.
Support and Resistance Lines: It also highlighted those levels which have typically offered a stiff resistance to the price’s advance, primarily because of the high amount of trade.
Liquidity Maps: Level of liquidity may be shown on the chart using indicators such as Liquidity Finder or AlgoRhythmica’s Liquidity Map most of which highlight the zones of high and low liquidity on a chart 10.
Stop-Loss Clusters:Certain locations that many stop-loss orders are placed suggest the existence of potential liquidation centers.
.png) |
|---|
Liquidity ranges enable traders to make the right decisions on the time they should open markets and when to close them, exposure to risks, and fluctuations in price. “It is a basic component of trading which determines a large number of decisions made even by traders.”
A fakeout in trading is a situation whereby price bar opens in the anticipated direction and then reverses its direction and heads in the opposite direction of what technical indicators were predicting. This can trap traders who have taken positions in anticipation of the price continuing in a particular trend, you will find yourself stuck.
Traders are often trapped by fakeouts because:
Expectation of Momentum: The sentiments of the row traders may suggests that when a support or resistance level is breached, the price should move in that particular direction further due to velocity.
Stop-Loss Orders:Many traders set their stop losses around these areas and in the event that price action fakes out the trader, they are forced to incur massive losses.
Market Psychology: Lack of patience whereby, traders leap into positions as soon as they observe a breakout only to be caught up by fake breakout.
To avoid being trapped by fakeouts, traders should:
Utilize appropriate measures of risk management for instance closing the position at a safe distance below or above the support or resistance levels respectively when the price reaches a certain level known as the stop-loss level.
Utilize the preliminary signs of a signal for entry to trading: these can include a particular type of candlestick and an increase in volume.
Pay attention to the psychological aspect of the marketplace and ignore the noise of the emotional signals that may result in rash actions.
 |
|---|
| - |
Risk control and recognition of fakeouts are pivotal to traders in order not to give their rivals unnecessary bonuses. These are strategies that trading psychology In particular traders works to avoid as it is a way of establishing his/her discipline to be able to withstand the volatile nature of the markets.
An effective strategy for trading liquidity levels involves several key steps and confirmations:An effective strategy for trading liquidity levels involves several key steps and confirmations:
Identify Liquidity Levels: Use tools like volume indicators, support and resistance lines, liquidity maps, and stop-loss clusters to visualize areas of high and low liquidity on the price chart.
Look for Confirmation Signals: Before entering a position based on a liquidity level, traders should look for confirmation signals such as:
Catalysts: The occurrence of events or news that might lead to potential large fluctuations in the price of an asset.
Relative Volume: Next, calculate historical volume with the goal of determining how interest in the asset has evolved over time.
Technical Indicators: The use of Moving average, Relative Strength Index (RSI), Moving average convergence divergence(MACD), and Stochastic Oscillator can be used as trading signal confirmation.
Chart Patterns: Some of these include head and shoulders, double tops/bottoms, triangles and flags that signify entry buy/sell signals.
Support and Resistance: Determine significant price formations in which the price could not breakout or break down from.
Trend Confirmation: Be certain that it is in a trend direction through drawing of the trendlines or the moving averages.
Volume Analysis: This can bring credibility to the trade decision in a breakout or during a continuation of the trending move.
Fundamental Analysis: Defining ‘long-term trading’ Long-term trading involves utilizing stock market characteristics, financial statements of companies or global events for the trade.
Multiple Timeframe Analysis: Ensure that the signals you produce from your indicators also align perfectly with those from other time horizons to increase your confidence.
Market Sentiment: Consider the existing hemisphere in the market, particularly for the fluid markets such as the forex.
Risk Management: Implement proper risk management techniques such as setting stop-loss orders at a safe distance from support or resistance levels to limit potential losses.
Such steps are used in conjunction with various trading practices aimed at managing liquidity levels in traders’ operations. There’s no perfect way that can ensure absolute confirmation and therefore risk need to be managed as required.
To avoid fakeouts when trading based on liquidity levels, traders can follow these tips and techniques:
Confirm Before Acting: These patterns indicate when an investor should wait for affirmative signals that a trend reversal has occurred.
Strict Stop-Loss Orders: Another way is to set strong stop orders to minimize the significances of sharp price fluctuations in the market.
Follow Trends: Designed to adapt the trading based on the existing trends within the market place.
No Hesitation: It appears that fakeouts can happen very quickly, so being the first to respond could be advantageous.
Effective Risk Management: Employ strategies for risk management so as to peg the effect of fakeouts on overall trading.
Concrete Example with Detailed Steps:
Suppose you are in an active position trading a particular currency pair, and you observe a signal that may signal a breakout at some critical levels of liquidity. Here's how you might proceed:Here's how you might proceed:
Identify the Liquidity Level: Locate areas with high liquidity by trying to determine volume of stock traded and using charts to look at patterns.
Look for Confirmation Signals: Check whether the breakout is accompanied by other technical indicators or not, such as RSI, MACD etc., and it is in consistent with the trend.
Set Strict Stop-Loss Orders: The stop loss order should be placed at the breakout zone plus/minus the amount to control the possible losses.
Wait for Confirmation: Do not buy or sell in the trade as soon as a breakout occurs; wait for further indications that suggest the prices have indeed crossed the levels to their respective sides.
Use Multiple Timeframes: Check that the pattern has developed on higher timeframes, to avoid potentially entering a false signal.
Monitor Volume: When breakout occurs, the volume may be high and this can provide a strong evidence which supports your trade decision.
Risk Management: When entering the trading market on this trade, you should only take a small portion of your trading capital.
.png) |
|---|
Follow these steps and you won’t get caught on fakeouts and stand a good chance at getting profitable trades with regards to levels of liquidity.
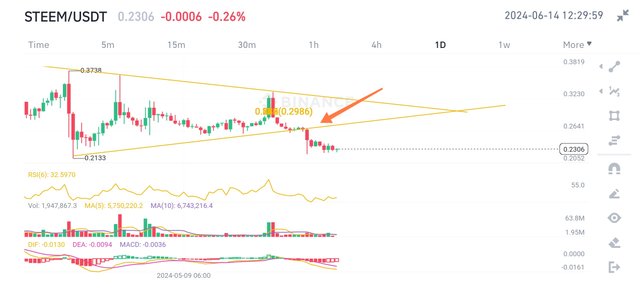
To assess the liquidity of tokens like STEEM, there exist several factors that can be examined, including the 24-hour trading volume of STEEM, the bid-ask spread for the token, and the depth of the order book for STEEM. It offers high liquidity where the trade volume is large and the bid ask spread is small implying that high quantities of the asset can be purchased or sold within a short span without causing a volatility.
As for the 24-hour trading volume, in this case, it stands at about $3 considering the given information. 9 million, indicating moderate liquidity Level of available money, or the liquidity ratio is 9 million, which indicates moderate liquidity. Since the bid-ask spread is estimates to be of the order of 2%, this means that there is possibility of change in price when trading takes place.
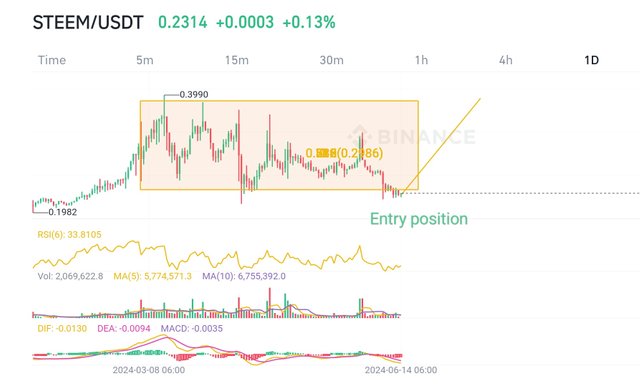
One possible trade strategy using these liquidity levels may be the initiation of the trade when a position is established in the futures contract during an upward price movement coupled with sufficient volume to support the trade. For instance, if the price of Steem has been steadily increasing while activity is high then it early for trading. On the other hand, if the price is dropping with the volume at the same level, then it might be the right time to off-load or sell.
Here's a step-by-step approach to entering and exiting a position based on liquidity levels:Here's a step-by-step approach to entering and exiting a position based on liquidity levels:
Entry Point: Ensure Steem price chart displays increased price with more trading volumes. Open a buy signal when a security surges above a delineated resistance line.
Position Size: Depending on the liquidity that is available in the market, you need to then manage the size of your trade appropriately. Good examples are moderately liquid markets such as the Steem; in such markets, you would prefer to trade the market in small volumes to avoid getting caught in slippage.
Stop-Loss Order: As with any trade, establish a stop-loss order at a disadvantageous level before initiating the trade to minimize your exposure to price drop risks.
Take-Profit Order: Place a take-profit order at a predetermined value at which particular rate you wish to close the transaction and make profits.
Exit Strategy: Be sure to change the identified exit strategy depending on how the market is like in terms of exiting. If liquidity drops, consider exiting at a sooner point so that you do not buy back at worse rate.
Once again, you need to know that trading cryptocurrencies is quite risky and therefore you need to first conduct your own research or consult with a professional financial planner if you can and understand your own risk tolerance before you start to trade this asset.
 |
|---|

I invite you to support @pennsif.witness for growth across the whole platform through robust communication at all levels and targeted high-yield developments with the resources available.
 Click Here
 | Category | Contest |
|---|---|
| Photo collect | Canva/ pixbay |
Thanks for reading the Post
14/06/2024
The End |
|---|
Upvoted. Thank You for sending some of your rewards to @null. It will make Steem stronger.
@shahariar1 hello i hope your good. Understanding liquidity levels in trading is crucial for making informed decisions. Liquidity levels indicate where large buy and sell orders are clustered acting as support and resistance points on the price chart. Identifying these levels can help traders anticipate potential market movements manage risks and optimize entry and exit points. This guide provides valuable insights into leveraging liquidity levels for successful trading. Good luck with the contest
Thank you very much for the valuable comments.
Hello @shahariar1
I read your post you can brifly explain trading view and explain tips and techniques to avoid fakeouts ...
Your post is interesting and informative. I have also participated in it ..
Best of luck for contest 💞
Thank you for reading and for the nice comments. Best of luck too you
Very nicely presented about the fake out. Falling into the fake out trap, many of us face huge losses that lead to losses. Realizing the fake out is really the job of the defender. If we can understand the fake out and calculate the liquidity level, we will not face any loss. Good luck to you for presenting it in a very beautiful way. Best of luck.
Thank you very much for leaving a constructive comment after viewing the post.
Your post has been successfully curated by our team via @𝐢𝐫𝐚𝐰𝐚𝐧𝐝𝐞𝐝𝐲 at 35%.
Thank you for your committed efforts, we urge you to do more and keep posting high-quality content for a chance to earn valuable upvotes from our team of curators and why not be selected for an additional upvote later this week in our top selection.
Nice and informative blog. Your clear explanation make more understand the topic. liquidity levels is key point to understand other traders sentiment towards the asset or market. Thank you.
Thank you sir for your support. Your support motivates me to post.
This is superb! The way you explained that liquidity levels indicate where large buy and sell orders are clustered is spot on. It's crucial for anticipating market movements!
Thank you very much for your constructive comment after reading the post.
Greetings @shahariar1,
You've got a great handle on breaking down the ideas about liquidity, fakeouts, and trading strategies based on liquidity levels. Your explanations are super clear and show that you really understand how all these things work together in trading. Keep up the awesome work.
Una de las cosas mas importantes del traders es determinar las rupturas reales e identificar las falsas. La mayorías de las rupturas implican cambios en la tendencia lo cual permite anticipar la jugada pero se requiere el análisis técnico minucioso con la combinación adecuada de los indicadores que ayudan a tener una perspectiva más clara o informada.
Sin embargo, el mercado es cambiante, volátil e inesperado por lo que una buena gestión de riesgo vale en cualquier circunstancia para no tener pérdidas inverosímiles.
Gracias por compartir, te deseo mucha suerte y éxito.