Steemit Crypto Academy Contest /S14W5 : Exploring STEEM /USDT Trading "
I hope all my friends are doing well and thanking Allah for His blessings because to some people I would like to wish people in the whole world Happy New Year in advance and some people I would like to wish those who belong to the Christian community here a Merry Christmas and I hope that they will be celebrating such joys and sharing in the new joys that others have and I hope. Hope you guys are enjoying this competition, it's truly the best competition I've ever been to in my beloved community and the fifth week of season 14 is on without delay. I am enjoying the competition very much and I would like to land in this competition.
canva editing
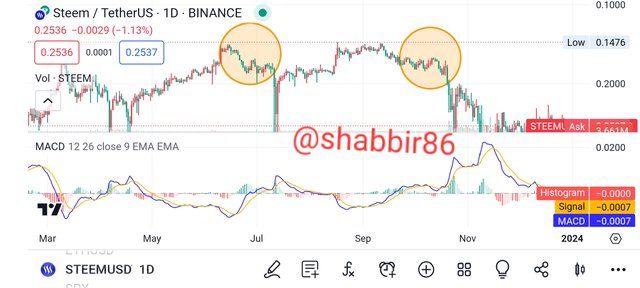
Using the MACD how can you identify a buy or Sell signal for the STEEM/USDT pair ? And what to do the upper band and lower band in the Bollinger Bands for the STEEM/USDT pair indicate ?
Until we fully understand how MACD works for identifying buy and sell signals for the STEEM / USDT pair, let's first look at MACD in brief. But it is very important to know, let us know it
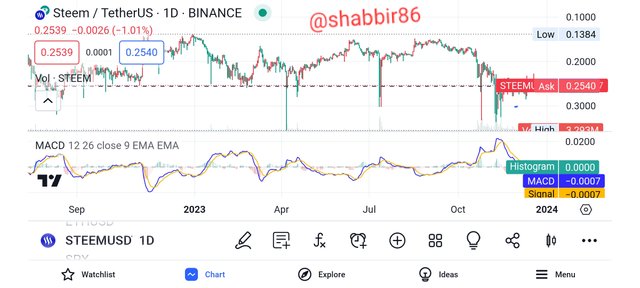
Screenshot from tradingview app
MACD stands for Moving Average Convergence We know that divergence indicator is two lines and in which MACD lines you can use MACD pairs or any steam USDT means That it can tell us about other pairs and signal whether it is oversold or overbought is a special kind of signal. Now let's look at STEAM to see how we can trade it for what USDT is and how we can run our system with it and MACD. How can you use it to identify the signal?
How to identify a buy or sell signal using MACD for the STEEM/USDT pair.
We can see that the MACD line has crossed above the line and it has also crossed above the bar chart. Now it is giving us a signal to buy which means we know that we can buy what is now and that buying now can be profitable for us and this trend is profitable. Maybe if on the contrary, if it goes downwards, it means that we sell it after selling it, it takes time to sell it, we get the signal that you can sell it, we know it from the signal.
As we can see MACD line which is it goes above the line also goes below and both these processes are happening we can clearly see in USDT chart from STEM. How is this line going up and down? This means that they are giving us a sell signal when the lines that are touching zero indicate that we are selling what we have and if the lines move upwards it means that we are buying what we have. and gives us a buy signal that lets us know that we can buy.
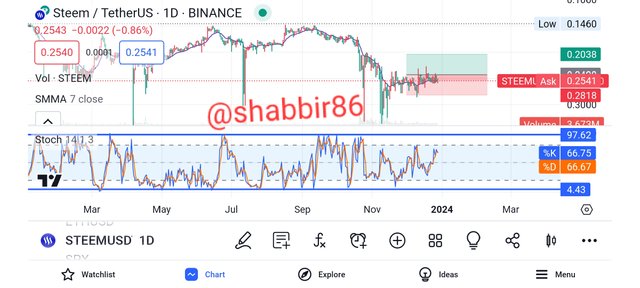
The upper band and lower band in the in the bollinger bands for the STEEM/USDT pair
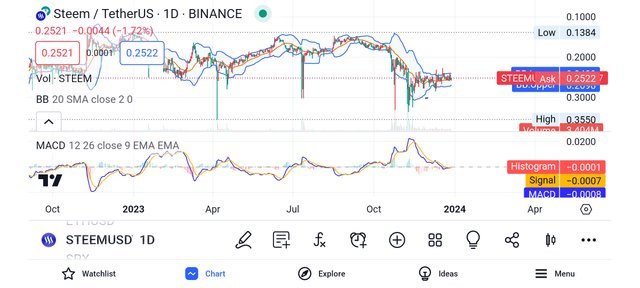
Screenshot on tradingview app
We can know and see that the Bollinger Bands are the upper, lower, and middle bands. This means that it is in between them. Using the STEEM/USDT pair we can see that when the Bollinger closed above the price became overbought and the buying increased slowly. A further downward trend has been increasing.
A question arises here that the very good buyers sell their STEEM as they are and wait for the right time. There are some buyers who take a stand here and wait for the price to pull back again, and many times it does, and people recognize the right volatility and the trend. What they are waiting for ends and they get what they want.
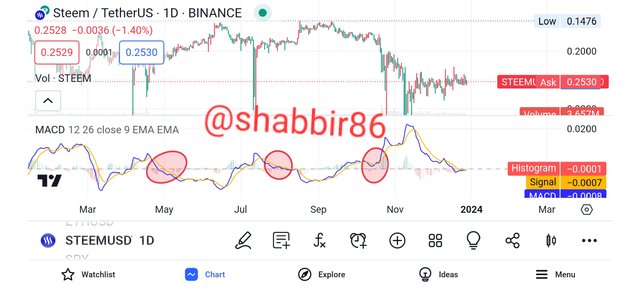
Screenshot on trading View app
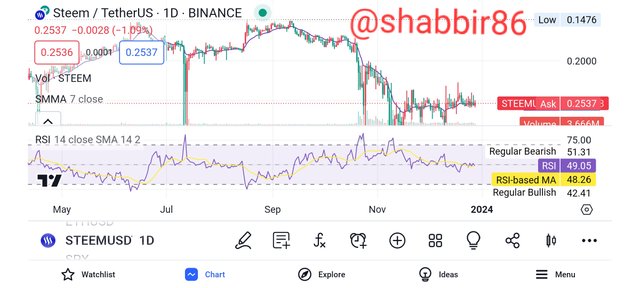
How can the combination of RSI and moving average help determine entry and exits point for STEEM/USDT? and how could a trader use the stochastic oscillator to confirm bullish or bearish trends in the STEEM/USDT pair ?
As we know that the combination of RSI and moving averages determine and help the entry and exit points of the pair, we know that it is favorable to give additional signals and support to the traders. It can be proven that traders find what they have as the best signals and provide them with signals and remember when you as a trader combine the two, you become a trader. An additional signal and more valuable insight into reversal point skew trends is that we must first know how we use signals to buy. Let's know it.
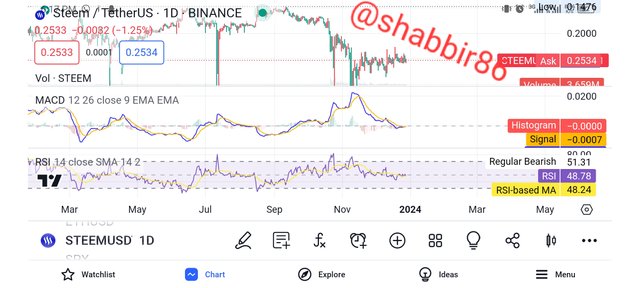
Using RSI and moving averages, STEEM/USDT are essential for selling signals, finding low highs and lows, and especially for identifying downtrends. Which is like confirming that it's below the level, which means that the down trend is visible here, which means that all of the all that is at the bottom is trending and bearish here. Look up the bearish moving average and you will know if there is a line here, there are crosses, that means the crossing is going up, then the lines are looking up. And this is because when this signal is visible to us, it is the signal of the cell and here the cell is visible.
Screen shot tradingview app
Entry and exit points
We know that information on inputs and outputs will require additional information and will require consideration of parallel levels and additional cases for additional information.
Screenshot on tradingview app
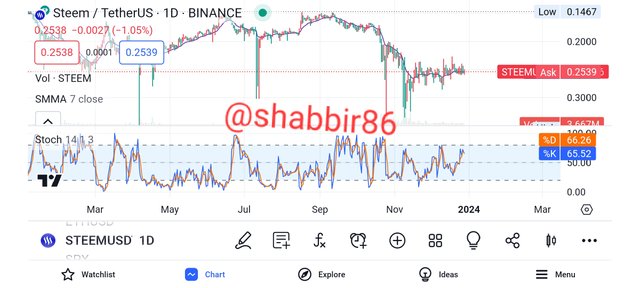
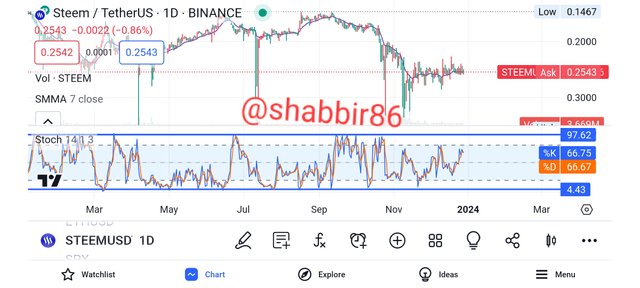
Using a Stochastic Oscillator to confirm blush or bearish trends in theSTEEM/USDTpair ?
Here, using the Stochastic Oscillator , you have to mark several of them above or below and tell it here.
Screenshot on tradingview app
Now Stochastic Oscillator If you are in an overbought or oversold area, then you should not panic at all, but you should look at the complete chart here and keep an eye on doing your work in a good way. One should be prepared on the movement of and watch the trends carefully to see which side the trend is higher and just follow it.
Screenshot on Tradingview app
How important is a stop-loss when trading STEEM/USDT and how can it be set based on technical analysis ? Why is it is essential to diversify positions when trading the STEEM/USDT pair ?
Stop loss is very important when trading. We know that a stop is something that protects traders from their losses and stops them from their losses and capital. The stop loss is what the market is all about and the most important thing about the stop loss is that it doesn't wake up to what is being watched. I have no doubt that this is a self-serving order and it protects me from all kinds of harm and does not allow me to suffer any kind of harm and also protects me from further harm.
Screenshot on tradingview app
Let me give you a small example for example Steem is trading on USDT and I buy some amount like some amount of USDT I have in front of me for example I call it 0.50S But if I buy, then if it goes to 0.45S, then I can no longer hold it, which means that I will leave with a loss, which is so small, because I have two stocks in it, either my own. Consolidate the position or maintain my position or close my position it's all in my hands and using trading view app I'm showing the screenshot below up here.
Screenshot on tradingview app
At this point set your stop loss-order at the level you want it to execute.
Diversification of positions is especially important when trading STEEM/USDT pairs because we don't know if the price will go up or down because most of the big traders who use stop loss. Both above and below maintain their levels and in all respects those who are mindful of their trading are able to give themselves maximum profit because they are long-term traders and Can help steam up to take profit i.e. use up take profit earlier than it will pull back your stop loss.
Fundamental analysis
When fundamental factors should one consider before taking a long or short position in STEEM/USDT ? And how can external events such as announcements related to STEEM or stablecoins influence the trading of the STEEM/USDT pair ?
Before taking a position in STEEM/USDT you have to make your own decision whether to go long or short or to go short. How you define bullish or bearish depends on you. If you are bullish and you think there is a really big bullish trend here, then you should take a long position because In this you can increase the chances of maximum profit and if you want to trade here and are in favor of trade, then you should buy as much as possible and buy as much as possible.
If you feel the price of USDT Steem that there is a bearish trend, then you can make your own decision, you have a stand in your hand and you can short your position if you The sale of what is here is right and correct, then of course you will be able to get profit here and you will get profit here, but here if your decision is short or long or wrong, then this is your loss.
I'm going to say one thing that can save you in this situation is stop-losses that can save you in this situation and amplifying events such as steam stablecoins affecting the steam-to-usdt pair here. What is announced is a fact. If the announcement is in your favor, it means that the market will rise and the trends will be more and more.
Will carry and go long because people will get a lot of leverage here and it will be in people's favor if the announcement is negative which is not in favor of the STEEM/USDT pair meaning it is going negative. Losses are going to be going down and the price will go down, so people will sell a lot of what they have and make a lot of profit and we know that all of this can happen according to the rules. is and all these things that are are specially for action, and that which is in them, by action, by laws, everything is possible.
Leading indicators
A part from commonly used indicators what other leading indicator could be useful to analyze the behaviour of the STEEM/USDT pair ? And how can trading volume be interpreted To predict future movements of STEEM/USDT?
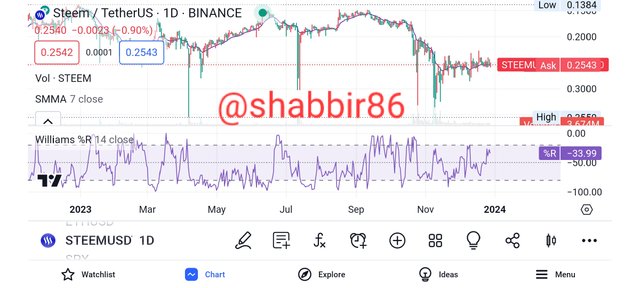
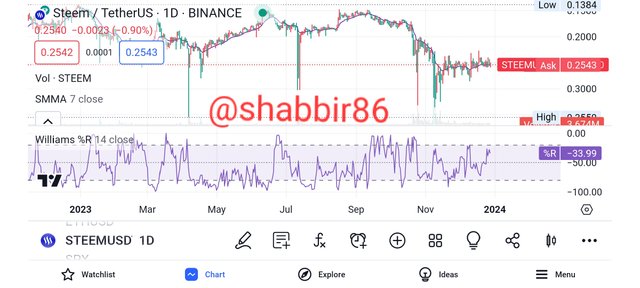
Williams %R This is an important indicator that can be helpful for experimenting with the USDT pair from Steem and it is very beneficial for it. I will tell you his name Stochastic Oscillator
If we talk about the difference between these two, then the difference between them is that the William indicator works on a negative scale and its quantity, if you tell, is from zero to 100, and if I talk about the scale, 20 and 80 is mostly used for trading scale either to buy or to sell.
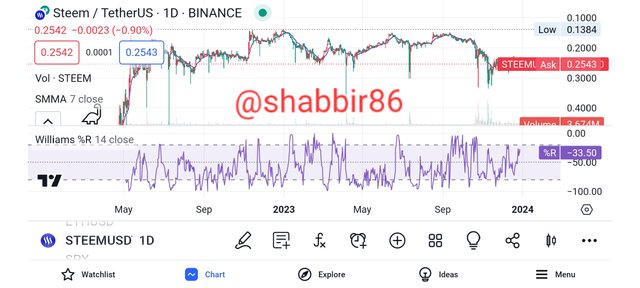
We see that STEEM/USDT is down on the 80 chart, that means if you see the green line and the green indicator, that means you have the potential to profit on this team here and on this one. If the line that is the danger sign means that it looks red, then you are at risk USDT/STEEM is used to know the trading volume and future movements as it is very beneficial for traders as it tells the traders to know the movement of STEEM.
For and to dig deeper into this means it can be helpful to measure and interpret sentiment in the market from STEEM/USDT gauge its liquidity. This is where the measurement of the market can be estimated
Screenshot on tradingview app
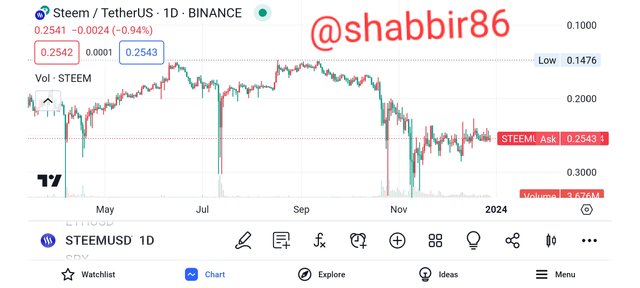
This means that we can infer from all the activity that the amount of buyers and sellers here is increasing. Those who are are more then we are clearly seeing that the buyers are more than the sellers and the sellers are less which means it is clearly giving us green signal and all our The activity is telling us that the buyers here are very high.
We can know that each of the candlesticks is looking to represent the market and if the STM closes with its upper volume candle and its candles we see that its candles are clearly green. Hint and Hint A green signal means there is no risk here and it all looks very interesting to the viewer. Those who are will see you very little, meaning that the green sign everywhere is welcome.
Conclusion
If I talk here, it has been a very interesting challenge for me and all the engagements have been very great here because here I have got to learn so many things and so many things have asked me to learn myself and I have learned a lot and many technical things I got to learn and I am very happy here that means I have tried my best to answer the questions asked about it and I have worked very hard. was able to try to answer it.
i would like to invite [ professor @kouba01 ][ professor @pelon53 ] @suboohi @stef1 @patjewell @tocho2 @ashkhan and @chant to take part in this great and beautiful contest

Thank you, friend!


I'm @steem.history, who is steem witness.
Thank you for witnessvoting for me.
please click it!
(Go to https://steemit.com/~witnesses and type fbslo at the bottom of the page)
The weight is reduced because of the lack of Voting Power. If you vote for me as a witness, you can get my little vote.
https://twitter.com/shabbir_saghar/status/1740707301244444817?t=71Qgc0H2gPBLJatNpf7dLw&s=19
Your explanation has proof to me that you have good understanding of technical analysis sir. Thanks for sharing quality post with us. Good luck.
@jasminemary
Thank you very much you know a lot about this and about crypto especially you are very attentive other activities are great and thank you very much for commenting on my post stay safe
Hey friend you have written so so well and I appreciate your educative and very informative article or steam blockchain such quality of articles are what makes things very powerful.
I really love how you analyzed steem price with so much indicators that I'm sure that your price decision would only generate positive and large profit to all traders including you which in turn will increase the use cases of steem native coin
Thanks for sharing wishing you success please engage on my entry https://steemit.com/hive-108451/@starrchris/steemit-crypto-academy-contest-s14w5-exploring-steem-usdt-trading
@starrchris
Thank you very much for reading this post and we have really learned interesting things from what you have described. In fact, we find various things that are up and down in the market especially in terms of experience. We have to go buy things when the market goes up and sell when it goes down. This is the rule of the market and we know that we will lose very little. Which is the very main point that we see which is specifically the stop loss indicator, it gives us very little loss and it saves us from a huge loss. Thanks a lot and also thanks for the excellent comment on this, pray keep up the good work.
Wow, my friend, you've written an amazing article. I really appreciate how educational and informative it is, especially when it comes to the Steem blockchain. Articles like yours have a real impact and make a big difference.
I'm so impressed with how you analyzed the price of Steem using various indicators. I'm sure your trading decisions will bring positive and profitable outcomes to all traders, including yourself. And as more people see the value of Steem, it'll lead to even more ways to use the native coin. Keep up the fantastic work, my friend.
@sahmie
Thank you very much dear friend, you read this base post and gave an excellent comment on it. Understood and mentioned these points in particular we see two indicators green indicator and red indicator these two indicators which adorn the market in particular and others thank you very much I am very grateful to you that you Very good read this post, keep up the good work.
Great work comes from Great people and attracts great minds and your entry is nothing short of that.
Well spoken. Stoploss is key and life saving for every trader. It is what ensures that a trader remains relevant in the market. Without it, he will be sent back to his village....
It is important that for every trade opened. The stop loss must be set.
Not doing this have rekted so many traders in the market.
Thanks for your detailed explanation. wishing you the best in this contest.
@ngoenyi
Yes madam up rightly said a stop is something where it stops people and protects them from losses. There are many other people who suddenly jump into the market but they end up losing a lot of money. On the contrary if they use stop loss it saves them from many losses and their valuable capital remains in their own hands Thank you very much for reading this post and a Excellent comment, I pray you always keep up the good work.
Predecir del futuro es todo un desafío, con estos indicadores MACD, Bandas Bollinger, RSI, Oscilador Estocástico, así como la implementación de los stop-loss, etc, se trata de lograrlo, pero existen mucha variables externas que pueden echar abajo una tendencia que técnicamente es factible.
El conocimiento va más allá de lo técnico y debe acompañarse de la observación e investigación de los agentes perturbadores sentimiento del mercado.
Has tratado los temas con sabiduría, te deseo el mejor de los éxitos.
¡Feliz Año Nuevo!
@casv
Thank you very much. You read this post and gave a great comment. Of course we know that the market is what it is. Sometimes there are some indicators that keep moving. It's up and down it's volatility it's moving along we know it's stop loss it hurt people very little and save people's real money else you understand the post well And I hope we continue to grow in the same way. Thanks a lot for reading the post and Happy New Year to you too.🎆🎇🎆🎇
¡Feliz Año Nuevo amigo!