Steemit Crypto Academy | Season 2 Week 8 | Bollinger Bands | Homework Post for @kouba01
%20(1).jpg)
I am writing this post in response to the assignment task given by the professor @kouba01 , I really enjoyed, understood very clearly and really appreciate and thankful to you for your work for the steemit community .
Define the Bollinger Bands indicator by explaining its calculation method, how does it work? and what is the best Bollinger Band setup?
Bollinger Band is an Indicator tool used in trading chart to analysis the volume and price movement of the assets in financial markets. It provides information about overbought and oversold areas on the chart. When there is low volatility , Bollinger Bands are become narrow or sqeezed. But if the volatility is high , The Bollinger Bands expands also provides information about volatility.
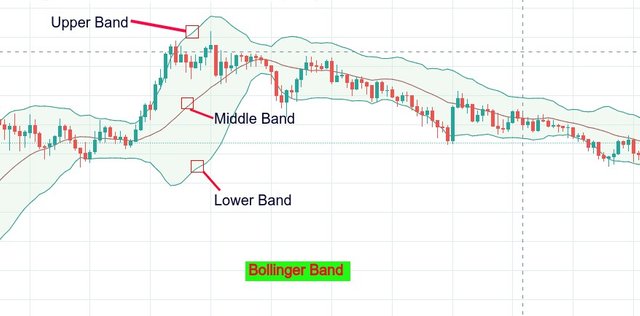
Image source: Tradingview
If the price is close or hits the upper band , it is considered as overbought and price may fall down from there towards lower band . If the price is close or holding at the lower band, price is considered to go up towards upper band.
There are 3 bands which collectively is a Bollinger Band - Upper band , lower band and middle band.
Middle Band: it is a 20 period Simple Moving Average .
Upper Band: It is shifted up by 2 standard deviations of the 20 period moving average.
Lower Band: It is shifted down by 2 standard deviations of the 20 period moving average.
In above image you can see the upper band, middle band and lower band which is showing market trend and volatility.
How Bollinger Band Works
It works and helps the trader by following ways:
Volatility: it clearly shows us the price and volatility movement in the chart, when there is low volatility, bands become narrow which shows low volume , low volatility and accumulation or low interest of people/low demand . From that point the price may either pump or dump. Below in the image you can see clearly thw low volatility and high volatility in price movements, traders can get clear idea about the trend and volatility from bollinger band .
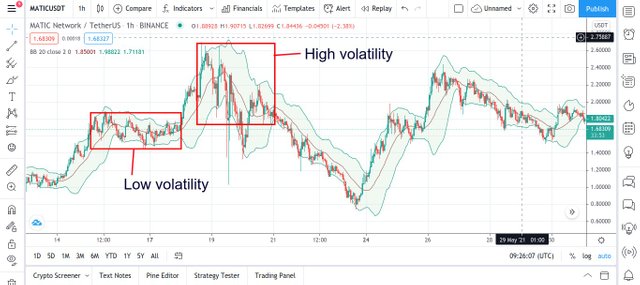
Image source: Tradingview
Oversold and Overbought: Bollinger Band moves within its upper band and lower band which indicates the Overbought and Oversold area. Upper band represents overbought and lower band represents oversold.
If the price is close or near to the lower band, it indicates oversold and more and more traders will accumulate in that area , price go up toward upper band from that area. When price reaches upper band which is considered as overbought , more and more traders will start booking profits and again price come toward lower band. This cycle continues.
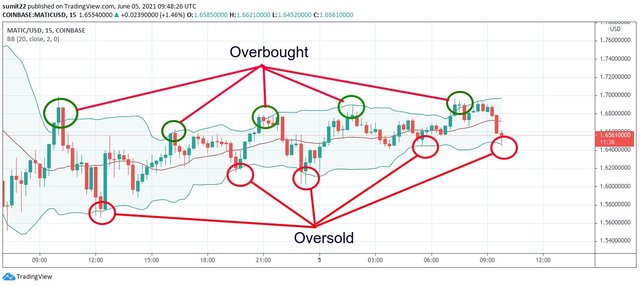
Image source: Tradingview
You can see in the trading chart image, when price hits lower band(oversold) area, the price move upward towards upper band. When price hits upper band(oversold) area, price moves downard towards lower band.
Best Bollinger Band Setup
Basic Default setting for Bollinger Band is 20 period Simple Moving Average and Standard Deviation is 2. But we can change it as well as per our strategy . It can be changed easily by going to the setting icon of the indicator . Length means period (example 20 day simple moving average , 10 day SMA ). You can adjust it as per your requirements. Default setting(20 period SMA and Stdev 2) is supposed to work better .
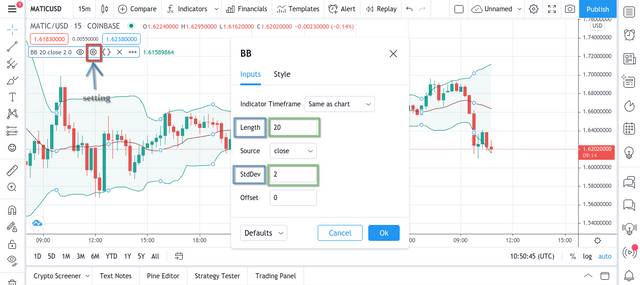
Image source: Tradingview
.jpg)
What is a breakout and how do you determine it? (Screenshot required)
Price rise upside away from resistance or price fall from support is known as Breakout . In simple line, when current or previous resistance or support line is broken , it is called breakout. After the breakout price moves upside or downside . High volatility occurs in price while or after the breakout either upside or downside . If resistance break, price rise. If support breaks , price drops.
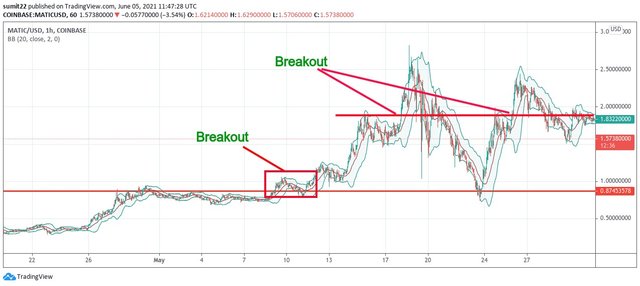
Image source: Tradingview
In the above image ( MATIC:USD pair) you can see a major breakout happened after long accumulation zone. As the price broke the resistance area, price pumped very well . You can see lots of other breakouts in the chart. some breakouts on the upper side some on the downside. Initially the bands are sqeezed and very narrowed but when price moved across the resistance area, you can see bollinger bands started expanding and showing volatility .First resistance of $0.8745 broken up and after the breakout price moved in upward direction for long time and price reached $1.8322 . There are several ups and downs in price after that. In this way bollinger band helps us to identify the market trend and volatility.
How to use Bollinger bands with a trending market? (screenshot required)
In trending market bollinger band also follows the market trend because the middle band of the bollinger band is Simple Moving Average So, bollinger band is also co-related with the market trend and follows the market trend as well. When marker is in upward trend , bollinger band will also move in upward direction and if the market trend is downward , bollinger band will move toward downward direction.
We can take advantage of the trending market by using bollinger band . Bollinger band clearly shows the trend of the market.
.jpg)
As you can see in above image, the market is in trend, first uptrend and then downtrend and again in uptrend and bollinger band is also following the trend and we can easily identify the trend of the market. If the market is in uptrend then consider buying after analyzing the price and movements. Never go against the trend in trending market. Buy in lower band if the market is trending in upside. And if the market is trending in downside, consider selling at upper band . Mostly in trending market price may not touch both the bands, so consider buying or selling at Middle band in trending market . You can see price is moving upside simultaneously in uptrend and price is falling downside in downtrend. This is how we can analyze the market trend and we can trade in trending market condition.
What is the best indicator to use with Bollinger Bands to make your trade more meaningful? (Screenshot required) (Screenshot required)
Almost all the indicators are lagging indicator and they shows price movements after the real price moves . Indicators shows price movements following the actual price or the past data. There is no any indicator which gives us 100% accurate signals or predicts the future price. However , we can utilize the indicators combined with other good indicators and technical analysis which can help us in analyzing the market in more better ways.
In my own experience RSI indicator is the best indicator which can be used and works better with the bollinger band. RSI indicator shows the oversold and overbought areas in all kind of market conditions. Similar to the bollinger upper band and lower band , RSI also has higher and lower limits : 70 and 30 . If RSI hits 70 or above , it is considered as overbought and price may decline from that area towards downside. Similarly if price hits 30 or lower level, it is considered as overbought zone and price may rise from that area towards upside.
We can combine both these bollinger band and RSI indicator for better signals and confirmation of the current market condition.
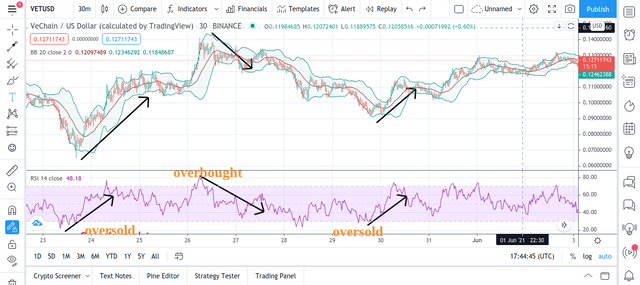
In the image you can see the bollinger band showing volatility and market trend , and RSI showing overbought and oversold zones which helps us to identify the possible reversal of the market trend . Price pumped up from oversold zones in RSI and price rose up . When RSI level 70 was hit which is a overbought zone , price fell down from that area and market trend changed to downward in short time frame. This is how RSI indicator is the best indicator that can be used along with bollinger band which helps in analyzing the risk or possible reversal of the trend of the market.
What timeframe does the Bollinger Bands work best on?And why? (Screenshots required)
Timeframe varies from person to person. Different people use different strategies , different indicators , different tools and techniques. We cannot say exactly this or that timeframe work better, because it totally depends upon the market, asset and trader.
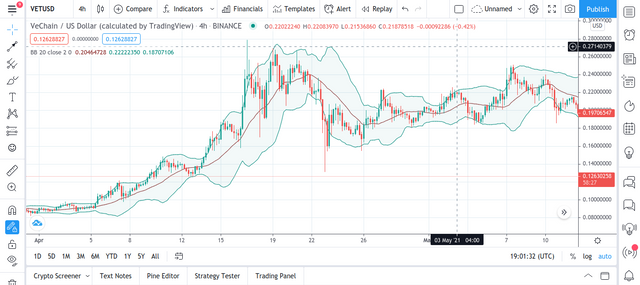
In above VET USD chart you can see bolling band is showing the market trend and also price movement and volatility properly in 4 hours candle chart . You can check the chart in multiple time frame and analyze which is providing the proper idea of the price movements.
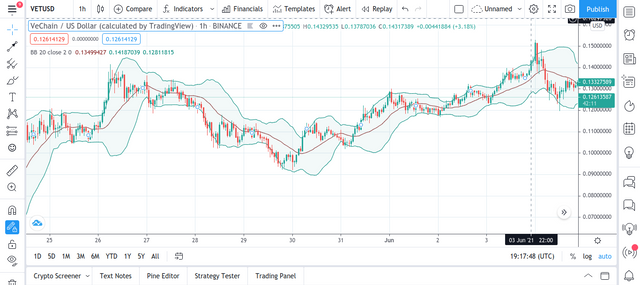
Above chart is 1 hour time frame chart of same VETUSD, here also we can see clearly the market trend and volatility and yes in 1 hr candle chart also looking good and bollinger band providing information of market condition and price movements.
Review the chart of any pair and present the various signals giving by the indicator Bollinger Bands. (Screenshot required)
Bollinger band generates signals and provides price movements information and trend information.
I am analyzing the VETUSD chart in 4hour candle time frame by using the Bolling band indicator below :
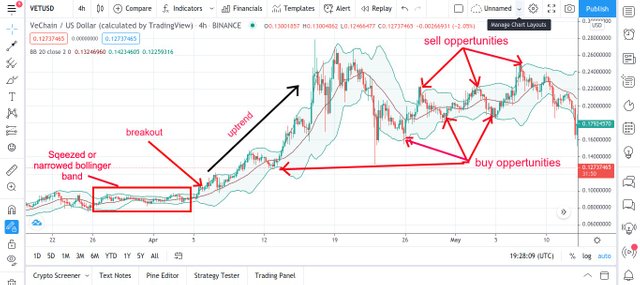
You can see in the chart initially there is very low volatility and no any movement in price , bolling band is squeezed and narrow, it is seen that after this a big price movement or breakout happens either upside or downside. In VETUSD chart the price breakout the resistance levels and pumped toward the upside . The market trend is contiously upside and after breakout price rebound to the lower band of the bollinger band which is a good opportunity for buying at that demand zone(lower band). From lower band price again pumped following the market trend and bollinger band clearly showing high volatility in price and price movements.
It provided lots of signals in the chart which we can see , when the price is hitting upper band(supply zone) price is retracing towards lower band(demand zone). When price hitting lower band ( demand zone) , price is rising up towards upper band. In this ways bollinger band generating lots of signals for buying and selling opportunities. We should always try to buy in lower price and demand zones. And should sell at supply zones. Trend of the market is also very important which must have to be considered while analyzing and trading .
CONCLUSION
Bollinger band is a very helpful indication in trading for traders . It helps in identifying the market trend, volatility and price movements. It provides information about overbought and oversold zones which helps in managing risk and maximize the profits. I would recommend to use other popular indicator along with bollinger band for more better results and success. Also check the chart in multiple timeframes for proprt confimation of the current and possible market scenerio.
Thanks Professor @kouba01 for this beautiful and interesting lecture. I'm looking forward to your next lecture.
Cc:-
@kouba01
@steemcurator02
Hello @sexualhealing,
Thank you for participating in the 8th Week Crypto Course in its second season and for your efforts to complete the suggested tasks, you deserve a 7.5/10 rating, according to the following scale:
My review :
Good job in which you dealt with the topic of the Bollinger Bands indicator analytically by answering the questions posed with a clear explanation.
Thanks again for your effort, and we look forward to reading your next work.
Sincerely,@kouba01
Thank you so much professor !