Crypto Academy Season | Week 3 - Season 4| Spotting Market Reversals With CCI | For professor @asaj
.jpg)
Grettings to all users and professors ! I am writing this post in response to the assignment task given by the professor @asaj , I really enjoyed your class and really appreciate and thankful to you for your work for the steemit community.
.jpg)
There are lots of trading platform where we can create our Demo and Live trading account But here i am going to open a Demo trading account on FXCM .
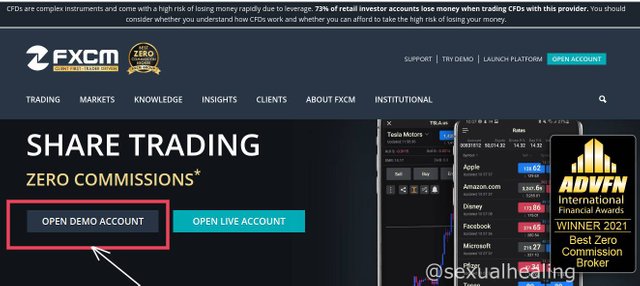
- Visit the FXCM official Website Link from mobile or PC/laptop. And click on OPEN DEMO ACCOUNT :
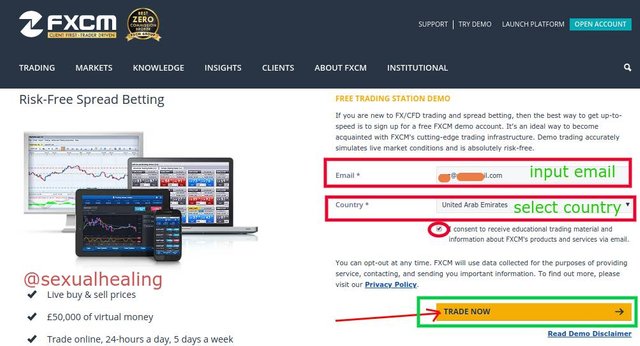
- Enter your email id and choose your country, tick on consent. Now click on Trade Now (You will receive your login id and password in your email) :
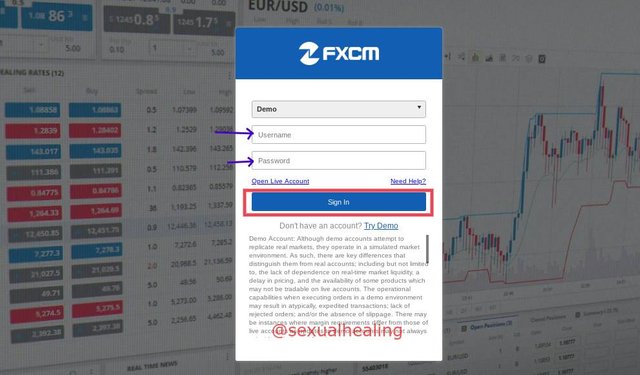
- Now your demo account is ready , now you can trade in both in PC and FXCM Mobile app as well. Mobile app is available for both Android and IOS users . Now login into your mobile app or FXCM Trading station using demo account login details :
- This is the Interface of the Trading Station , I have logged into the Trading Station (web trading platform by FXCM) :
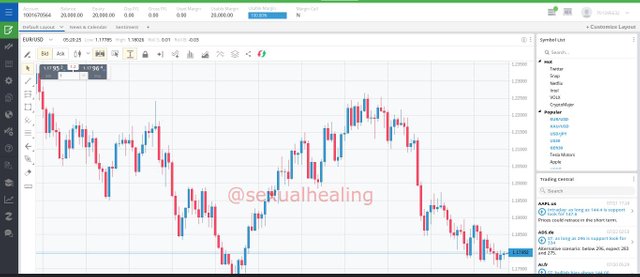
- To open the chart and trade on different assets , click on right side symbol list choose trading pairs and click on subscribe. I am going to choose and trade on cryptocurrencies pairs :
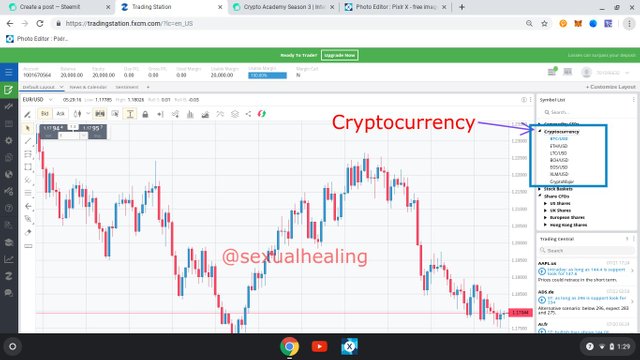
- All subscribed assets pairs are shown in drop down tab, now i am choosing 5 different crypto currency pair to watch the chart and trade on them. My 5 cryptocurrency pairs are : BTC/USD, ETH/USD, BCH/USD, EOS/USD and LTC/USD :
- This is how we can add indicators and use tools on our chart for trend lines drawing and adding different Trading indicators. Tools can be selected from left side tools section. And Indicators can be added by clicking on the Indicator button as showing on the image:
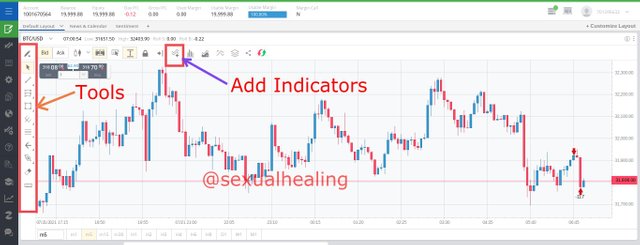
- Below we can see there are quick buy and sell tab available , i have setup my CCI Indicator on the chart . On the bottom of the chart we can see candlestick chart time frame like 1 minute, 5 minute, 15 minute, 1 day etc. We can choose the candlestick chart timeframe according to our strategy and requirements:
.jpg)
There are lots of trading tools and strategies/techniques which helps us in achieving good profitability in trading. Here i am going to explain about some simple but very effective Trading Strategies which helps us to gain good profits in financial markets.
Trend line: Trend line helps to identify the trend of the market. Trendline also helps to identify change in market trend as well. We should always try to trade folowing the market trend and shouldnot trade against the market trend. And in case of trend change to avoid loss or minimize the loss, i use and recommend must use stop loss .
Indicator: Indicators and technical analysis plays a vital role in all kinds of financial markets. Indicators gives us idea of the market condition and possible upcoming changes . Indicators help to gain and maximize good profits if used properly along with other trading tools and indicators.
Here i am going to discuss about an Indicator called Commodity Channel Index - CCI. This is a oscillator indicator which moves up and down inside a dynamic channel. This indicator helps us to know about oversold and overbought areas and possible reversal of trend or price . Oversold means demand zone where the traders buy or accumulate the assets . And Overbought means supply zone where traders sells or exits from the trade after booking profits. CCI helps to identify the possible reversal of the price of any financial assets.
CCI indicator looks like RSI indicator but it is different from that. RSI have only level of 0 to 100 (0 on downside and 100 on up side). But in CCI there are 3 levels on upper side , Middle central level and downside. Those levels are +100 on the upper side, 0 on the middle and -100 on the down side . But these oscillation level are not limited to 100. The level can be more higher or lower than the +100 or -100 like +200 to +300 similarly on the downside also it can be -200 to -300 or even more.
If CCI indicator line is above +100 we have to sell after confirmation of the reversal and if the line is below -100 we have to buy after confirmation. Sometimes CCI might give false signals , to avoid false signals we can take the help of other Trading Indicators like RSI, MACD, Bollinger Band etc.
I prefer buying or selling at around +250 or -250 level of CCI . If the market trend is upward then consider only buying and if the market trend is downward then only consider selling
Below on the chart we can see buying and selling oppertunities and how to use it (based on my strategy):
- Buying when market is uptrend:
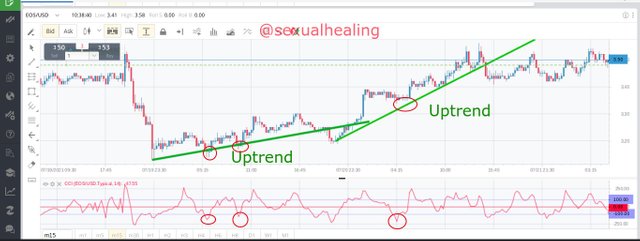
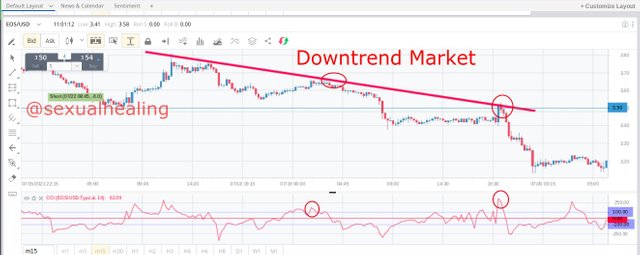
- Selling when market is downtrend :
There some other indicator also you can use for confirmation and to eliminate fasle signals. I follow trend line and the market trend to filter out false signals.
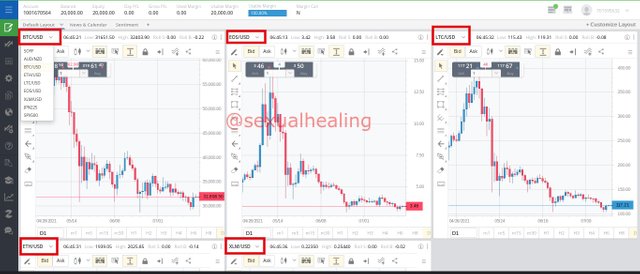
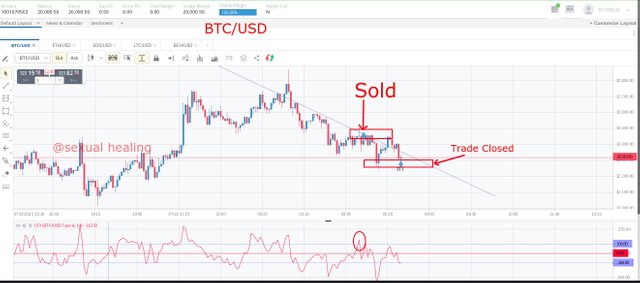
- BTC/USD: The market was is downtrend in 5 minute candle chart as we can see on the chart and i also drawn a trendline, the CCI line was above +100 line and trend line resisnace was was also there . So i took a sell trade following the market trend :
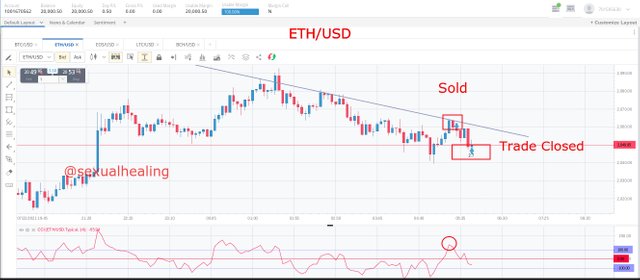
- ETH/USD: The market was is downtrend in 5 minute candle chart. The CCI line was above +100 line and the candle was rejected from trend line Resistance . So i took a sell trade following the market trend and rejection from the trendline :
- XLM/USD: The market was is downtrend . The CCI line was above +100 line and the it was looking like the trend changed but even if the trend changed it will come down for a retest near trendline and support area and there was minor
resistance as well . So i placed a sell order there . And yes prices came down from that area and i booked profit and closed trade :
.jpg)
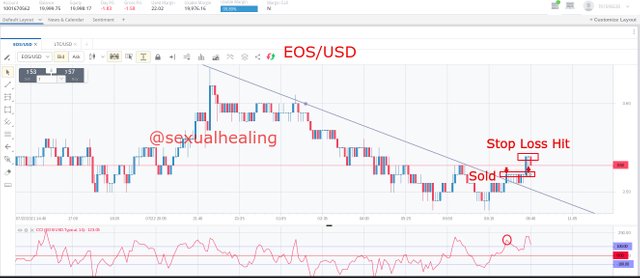
- EOS/USD: The market was is downtrend. The CCI line was above +100 line and the candle was close to the downward trending line which was suppossed to work like a resistance . So i took a sell trade following the market trend but the candle wentupside to possite of the trade. My Stop loss was there so trade was closed with a minimal loss :
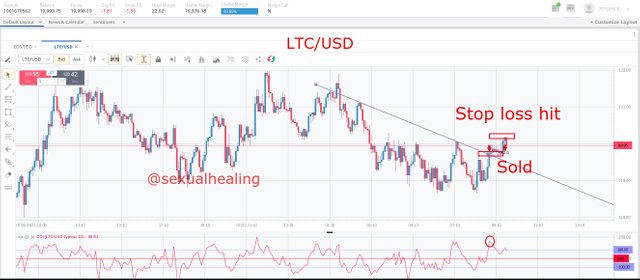
- LTC/USD: Similar case happened with LTC/USD same as EOS/USD. The market was in downtrend . Resistance area was there and also trenline was there which i thought it would work as resistance . I took a sell trade close to the trendline . But the price moved against the trade. Stop loss saved me from higher loss and trade was closed as soon as it hit the Stop loss :
I traded on 5 cryptocurrency pair in which i booked profit in 3 trades and in 2 trades my Stop Loss was hit . All crypto pairs were in downtrend in smaller time frame. Here is the result of my trades :
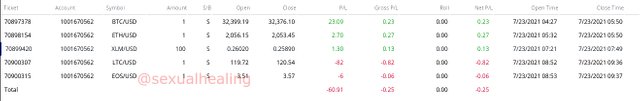
Total Trades: 5
Profit: 3
- BTC/USD: $23.09 profit
- ETH/USD: $2.07 profit
- XLM/USD: $1.30 profit
Total profit = $26.19
Loss: 2
- LTC/USD: $82 loss
- EOS/USD: $6 loss
Total loss = $88
In my 5 trades i beared total loss of $61.81
I took all trades using same 1 lot and i put stop loss on all my trades . Stop loss is vey much important to avoid huge loss if the market goes against the trades. I put stop loss at and take profit at the ratio of 1:2 . If the stop loss is 10% , take profit will be 20% . Sometimes if the market is less volatile and dull i use 1:1 risk to reward ratio. Stop loss and take profit is must in Trading . It helps to minimize the loss and maximize the profit.
Note: In LTC/USD pair the same 1 lot was used but margin was higher than other pairs by the platform and resulted high loss . In same other trades on same level of profit or loss the result is quite different. And different pair had different margins even tough i used same lot. So, while choosing the currency/cryptocurrency pairs you should take care of lot size .
CCI is a lagging indicator which moves after the candles formation and moves following the candles. We shouldnot completely rely on any indicator because frequently there indicators give false signals along with trues signals. So i would recommend using CCI on higher time frame candlestick chart with proper support and resistance along with some other popular indicators like MACD and Simple or Exponential Moving Averages. Stop loss and take profit you must have to set according to your risk and reward ratio. Always us minimal lot size while trading on any financial markets.
Good job @sexualhealing!
Thanks for performing the above task in the fourth week of Steemit Crypto Academy Season 3. The time and effort put into this work is appreciated. Hence, you have scored 7 out of 10. Here are the details:
Remarks:
You have shown a good understanding of the topic. I noticed you make some loss in your demo trade. Well, even the best traders make losses sometimes. Besides, you did make profit in three out of the five coins in your portfolio.
Thank you so much for reviewing my post and appreciate your comments !