Steemit Steemit Crypto Academy Season 3 Week 2 Homework Post for @reminiscence01 – Beginner's Course : Introduction to Charts
Thank you so much professor @reminiscence01 for this lesson. It's really important to learn about charts and price trends before going into any trading activity. Below is my homework task for this lesson. Please join me!
INTRODUCTION
Charts are graphical representation of an activity, whether trading or any other activity which may require keeping track of past performance. For the purpose of the lesson, the charts discussed have to do with trading especially cryptocurrency trading. There are various types of charts ranging from point charts, line charts, candlestick charts etc. In all, charts are useful tools for the analysis of price.
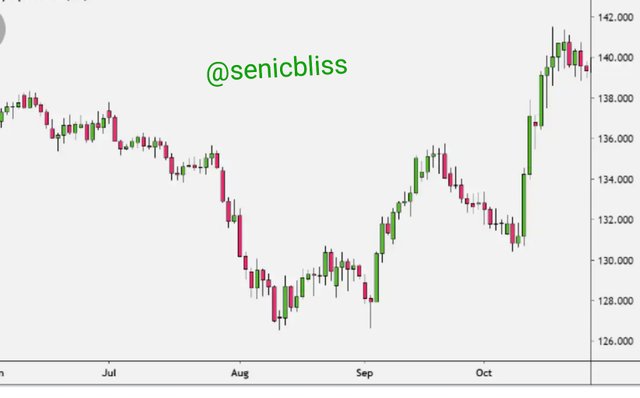
Japanese Candlestick Chart
A Japanese candlestick charts is a graph that represent the interaction between buyers and sellers using a set of arranged candlesticks. This chart shows systemically the movement of price in a specified period of time. With a Japanese candlestick chart the opening and closing prices are shown depending on the movement of the price. If the price movement shows an upward trend the closing price will be higher than the opening price and vice-versa.
Screenshot gotten from here
The Japanese candlestick chart also indicates the high and low price points for the period under consideration. It was designed by a Japanese rice merchant. This candlestick chart give traders the east of analysing price in a simple manner and predicting the possible price movements that may follow.
Other types of chart
There are other types of charts used in monitoring prices. Two of such are discussed below;
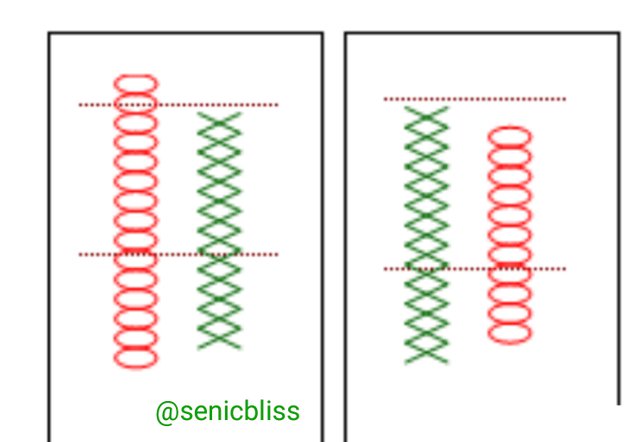
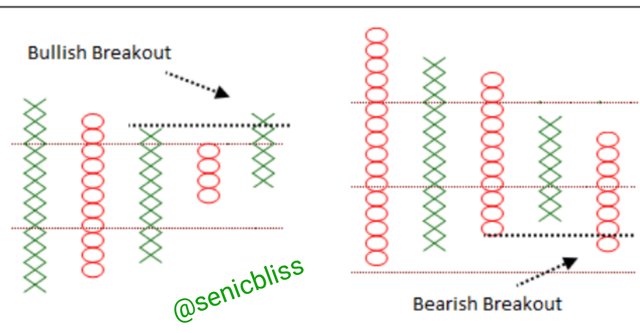
1. Point and figure charts
This chat uses symbols 'X' and 'O' to indicate a rise and fall in price in a column. While 'X' represents an increase in price, 'O' shows a price decline. As price keeps increasing (bullish trend), the chat will show a rising column of 'X', and as price goes down (bearish trend), the chat will show a column of 'O' moving downwards. Once there is a new movement, a new column is drawn.
Screenshot gotten from here
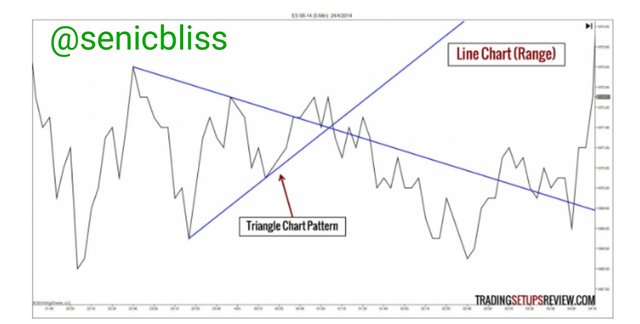
2. Line chart
This chart is simple and not very detailed. It is often used to observe the long-term trends in market prices of assets. it includes prices for specific periods. Line charts identifies and point out the closing prices of certain periods and connect them in order to establish the trends during such periods.
Screenshot gotten from here
Some reasons why the Japanese candlestick chart is widely used are as follows;
Traders work with price. Their ability to predict future prices will earn them an advantageous position in the market. The Japanese candlestick is also useful in the study and prediction of price trends since it deals with price movements.
Secondly, It can easily be understood especially due to the fact that it uses different colours for different price movements (bearish and bullish trends).
Thirdly, a trader can simply decide whether to go long or short following the trend shown by the candlesticks as well as whether to enter or exit the market. It gives traders and insights of the total price movements within a set period.
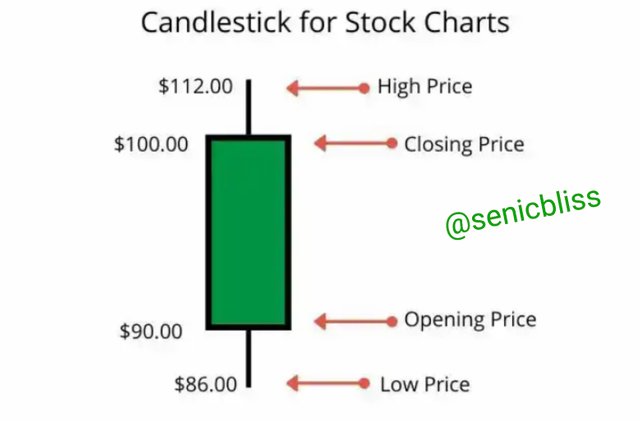
A bullish candle is a candle that shows an upward movement in the price of an asset it is mostly represented with a green colour candle.
It has four parts in its anatomy; the high price, closing price, opening price and low price. In a bullish candlestick anatomy, the opening prices usually lower than the closing price.
 Screenshot gotten from here
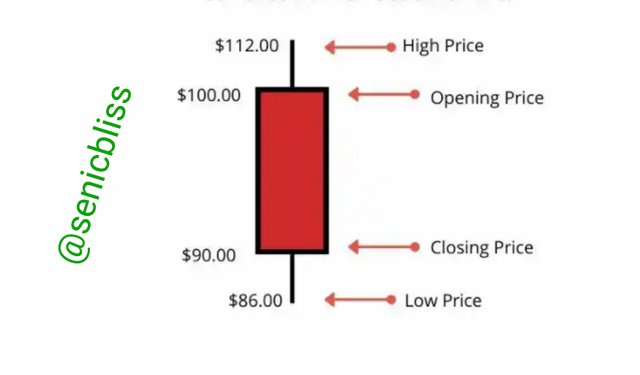
A bearish candlestick on the other hand, mostly represented with a red candle, shows the reduction in price during a set period. Its anatomy is made up of 4 parts, the high price, opening price, closing price and low price. In a bearish candle, the opening price usually above the closing price indicating that prices have reduced simultaneously during a specified time period.
 Screenshot gotten from herebull and bear
CONCLUSION
Charts in general are an important aspect of trading. In cryptocurrency trading, they allow traders to do technical analysis and know the trends in prices in order to determine a favorable time to enter and exit, as well as buy and sell. Japanese candlestick chart is a very preferable chart that is simply understood. Its anatomy is also simple. Other charts that could also be used as explained are point and figure charts as well as line charts. For ease of trade, it is advised that traders make use of chart for a better understanding of price movements.