Steemit Crypto Academy Season 5 Week 1 [Beginner's Course] - Understanding Trends: @sciencetech
Honestly it hasn't been easy, and I am grateful to God that I made it to the Season 5 of this great academy. Despite the new rules to help boost the community, God has been faithful. The lecture was perfectly delivered and by answering the few questions, I will be explaining my understanding of the lecture in the best way I can


1) a) What do you understand by a Trending market?
b) What is a bullish and a bearish trend? (screenshot required)
As we all know a market is formed by the buying and selling of an asset which is very much interwoven with the aspect of demands and supplies which form the basis of the market. The trending market is anchored by to main parties the buyers and the sellers.
The Trending Market talks about a market whose asset moves in a specific direction either downwards or upwards with respect to the time-frame at a given time. In the downward trend, we resolve to seeing the price within a specific time closing lower than the previous low.
Likewise in the upward trend, we resolve to seeing the price within a specific time-frame closing higher than the previous high. In order to succeed in the market one most understand clearly about the trending markets as it helps you to avoid a bad trade.
The investors and technical analyst believe that the trending market is predictable and a correct and accurate understanding of the trending market would give a boost on the return of investment.
b) What is a bullish and a bearish trend? (screenshot required)
Like I explained above when I mentioned the upward and the downward trend, it could also be seen as the bullish and bearish trend which I will be explaining below with a screenshot to help us understand better
BULLISH TREND
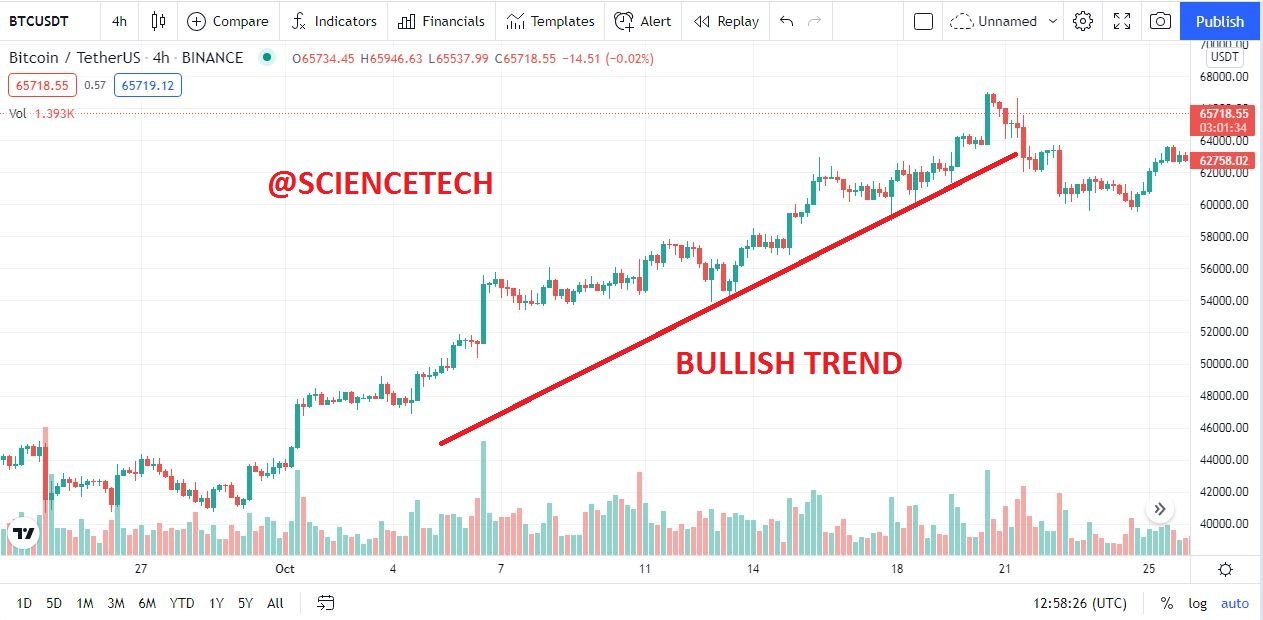
A bullish trend is an upward trend that successfully overcomes the resistance, creating a higher high and a higher low pattern ensuring that the price doesn't close below the previous high. This indicates the presence of buyers who cause an increase in demand thereby forcing the price to go up.
When an investor understands this bullish trend, he will get to understand that a little setback in the price of an asset is just a retracement for the price of the asset to move higher
below is the chart of BTC/USDT on a 4hr timeframe showing a bullish movement
BEARISH TREND
A bearish trend is a downward trend that successfully breaks the support creating a lower high and a lower low, ensuring that price doesn't close above the previous low. This indicates the presence of sellers who cause an increase in supply and a reduction in demand making the price of an asset to fall.
When an investor understands the bearish trend, he would understand and anticipate a trend reversal on the chart and market.
Below is an example of a bearish trend of the BTC/USDT chart on a 4hr time-frame

2) Explain the following trend identification and give an example of each of them. (Original screenshot needed from your chart). Do this for a bullish and a bearish trend.
i) Market Structure.
ii) Trendlines
MARKET STRUCTURE
A market structure is also known as the movement of the price action which helps us to identify the current movement of an asset whether it be bullish trend or a bearish trend. so it is a tool that investors and traders read and understand inorder to ascertain the movement of a trend.
BULLISH TREND
In this case we see the market form a series of higher high and higher low, in otherwords, the price falls below the previous low but ensures to close above the previous high. which gives investors an opportunity to buy and make profits during the higher low while waiting for a higher high

BEARISH TREND
In this case we see the market from a series of lower highs and lower lows, inotherwords the price rises above the previous high point but ensures to close below the previous low. which gives investors an oppotunity to make a perfect sell of the asset. to avoid loss in the value of the asset which they possess.

TRENDLINES
As we learnt in the lecture, a trend line is a line drawn by analysts to mark out points and know the marks that fits best, in other to determine the direction of the trend of the market. It helps to show the support and resistance of an asset over a specific time which varies for different investors.
BULLISH TRENDLINE
The bullish trendline is a line used to analyse and determine a bullish trend. In this analysis, the line is always below the price, where the trend line acts as a support to the price of the asset. we determine the points at which the price falls on the trendline and continues in its upward movement ensuring to close above the previous high.

BEARISH TRENDLINE
The bearish trendline is a line used to analyse and determine a bearish tend. in this analysis, the line is always above the price, where the trend line acts as a resistance to the price of the asset. we determine the points at which the price rises up to the trendline and falls back ensuring to close below the previous low.

3) Explain trend continuation and how to spot them using market structure and trendlines. (Screenshot needed). Do this for both bullish and bearish trends.
Just as we all know that the ratio to the demand and supply can never be 1:1 in the same vein the movement of a trend doesn't move in a straight line there are retracements that affect the trend from moving in a straight line. these retracements occur when investors are taking profit and the trend continues.
An understanding of trend continuation will aid investors and analyst to understand that a retracement could be a great entry point to begin the trend again. so I will be explaining how to predict a trend using the market structure and the trendline
MARKET STRUCTURE
BULLISH TREND CONTINUATION (MARKET STRUCTURE)
For a trend continuation using the market structure, we must understand that the market moves with a higher high and a higher low progression for a bullish trend signifying that the buyers are in control. meaning that along the bullish trend, there is a retracement that draws the price down before it continues in it's original direction.
However there are two key points to note when spotting the bullish trend using the market structure
- The recent low shouldn't be lower than the former or previous low
- The recent high must be higher than the former or previous high.

BEARISH TREND CONTINUATION (MARKET STRUCTURE)
For a bearish trend continuation using the market structure, we must understand that the market moves with a lower high and a lower low progression for a bearish trend signifying that the sellers are in control. meaning that along the bearish trend, there is a retracement that draws the price up before it continues in it's original downward direction.
However there are two key points to note when spotting the bearish trend using the market structure
- The recent high shouldn't be higher than the former or previous high
- The recent low must be lower than the former or previous low.

TRENDLINE CONTINUATION
Just as I explained above about the trend line helping to give support and resistance of an asset for investors to study and make the right decision. The trendline is also used to detect a trend continuation of an asset as asset do not move in a straight line.
BULLISH TREND CONTINUATION(TRENDLINE)
In the bullish trend, to detect a trend continuation using the trend line, we have to know that the point at which the higher low hits the trendline and bounces upwards serves as a support when making a new entry.
However some rules has to applied to ensure that the trend continuation is correct
- A break below the trendline is a breakage of the trend continuity
- Only the points that touches the trendline is to be counted

BEARISH TREND CONTINUATION(TRENDLINE)
In the bearish trend, to detect a trend continuation using the trend line, we have to know that the point at which the hi lower high hits the trendline and bounces downwards serves as a resistance to the asset.
However some rules has to applied to ensure that the trend continuation is correct
- A break above the trendline is a breakage of the trend continuity
- Only the points that touches the trendline is to be counted

4) Pick up any crypto-asset chart and answer the following questions-
i) Is the market trending?
ii) What is the current market trend? (Use the chart to back up your answers).
i) Is the market trending?
In this section I will be making use of the TRX/USDT chart on a 4hr time frame, we can see that there is a bullish trend on the chart when analysed using the market structure to check the continuity of the trend. we were asked if the market is trending the big answer is a YES. the market is trending as it doesn't defile the rules of a bullish trend in which the new higher high is higher than the previous high and the new high low is not lower than the previous higher low
ii) What is the current market trend? (Use the chart to back up your answers).
The current trend of the market is a BULLISH TREND looking at the chart below, we can see that the trend is continuous in an upward motion although we can see some retracement on the TRX/USDT chart on a 4hr time frame.
but we can also notice the lines that i drew on the chart showing the accuracy of the trend as no higher low is lower than the previous higher low. which shows the accuracy of the bullish trend.

CONCLUSION
In my homework post I was able to give my understanding of the Trends and the different types of trending throwing light on the bullish and the bearish trend.
I was also able to explain with charts the determination of a trend using the market structure and the trend line to show an accurate trend and how a defilation of the pattern could be a reversal.
For me I enjoyed the lecture and it was very educative as I learnt a lot while in the process of the assignment. Thank you all for going through my post
IMAGE REFERENCES
source
Best regards
@reminiscence01
Make sure you use your 10 votes a day...
Hello @sciencetech, I’m glad you participated in the 1st week Season 5 of the Beginner’s class at the Steemit Crypto Academy. Your grades in this task are as follows:
Observations:
That's correct.
Recommendation / Feedback:
Thank you for participating in this homework task.