Trading Using Rectangle Pattern - Crypto Academy / S5W4 - Homework Post for @sachin08
Trading Using Rectangle Pattern - Crypto Academy / S5W4 - Homework Post for @sachin08

cover photo made by @sargoon
Hello, Steemit Crypto Academy community! Here I am with my new homework post for Steemit Crypto Academy Beginner courses. In this homework post, I will give you information about Rectangle Pattern. I would like to start my homework by explaining the Rectangle Pattern in my own words.

Explain Rectangle Pattern in your own word.
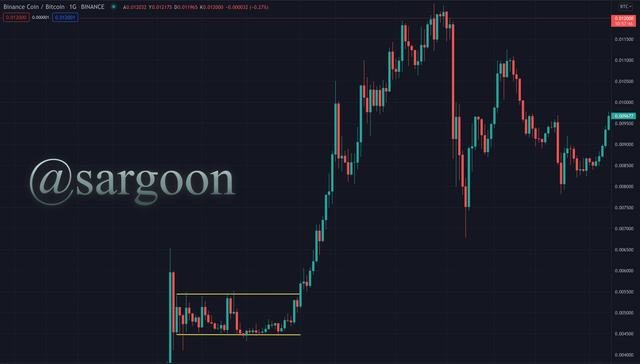
The rectangular pattern is obtained by drawing two parallel horizontal lines of the same length and proportion, touching the candlesticks. You should be careful while creating the rectangular pattern because the rectangular pattern is very similar to the double top and triple top formations, so some investors mistakenly create a double top and triple top formation instead of the rectangular pattern.
To avoid this mistake, we need to draw two equal parallel horizontal lines above and below the candlesticks. Candlesticks should be between two horizontal lines and should not cross the lines. The candlesticks inside the rectangle should touch the top and bottom of the rectangle with at least two candles above and below the rectangle, so a total of at least 4 candles should touch the bottom and top lines of the rectangle.

BNB/BTC pair from tradingview
Of the two horizontal lines we used for the rectangle pattern, the upper horizontal line is the resistance trend line and the lower horizontal line is the support trend line. To find the rectangular pattern more easily, it will be easier for us to use the rectangular pattern if we find a coin with a reduced volume and a stable price. The candlesticks of the coins with a stable price move in a horizontal plane, we create a rectangular pattern to determine the resistance and support trends to the top and bottom points of the candlesticks on this horizontal plane and determine the price breakout in the up or down direction.
When entering the trade, we need to set our stop-loss order at a price just below the support trend line. In a long position, that is, in the scenario where we think that the price will increase, we should take a profit at least as high as the horizontal lines we use while drawing the rectangle, according to the increase in volume.

How to identify Rectangles? Explain with Screenshots.
To identify the rectangle pattern, it is better to trade coins that have recently completed their price action. It is quite difficult to identify a rectangular pattern in a coin whose price is already rising or falling.

BNB/BTC pair from tradingview
Using the BNB/BTC pair, I added horizontal lines to form a rectangle at the top and bottom of the candlesticks where the price pauses, that is, moves in the horizontal plane.
As I mentioned in the first question, the upper trendline represents resistance and the lower trendline represents support. The candlesticks inside the rectangle should move in intervals between the support and resistance trendlines, and each of at least two or three candles should touch the support and resistance trendlines. If the candlesticks move out of the rectangle before completing the rectangle pattern and break the resistance trendline or the support trendline, the rectangular pattern will be canceled.
To put it simply, candlesticks make mini dips and mini tops between support and resistance trend lines in the rectangle pattern we have drawn, price gathers strength and gets stuck between the rectangles. As a result of the strategy we determined at the end of the squeeze, the rectangular pattern is completed by breaking the price below the support trend line or above the resistance trend line.

Can we use indicators with this pattern to get accurate results? Explain with Screenshots.
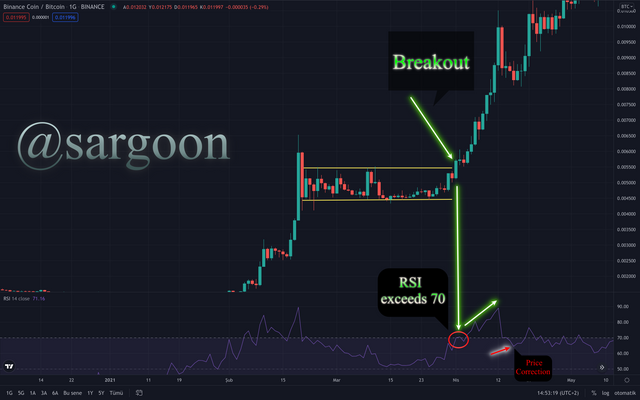
Of course yes, I definitely recommend using an indicator. The rectangular pattern is a very strong and highly reliable pattern to analyze the price, but if we use this pattern with an indicator, our probability of success in our analysis will increase considerably.
Many market makers and whales create fake patterns by creating many patterns on the chart, such as a rectangular pattern, to scare new investors. New investors who do not use indicators do not think that these formations are fake, they trade by adhering to the formation and lose their assets.
All traders should always use at least one indicator. Using an indicator both increases the reliability of the analysis and reduces your risk of loss. I will use the Relative Strength Index, the RSI indicator, for the rectangular pattern.

BNB/BTC pair from tradingview
The most important points for the RSI indicator are 0-30 for the bottom and 70-100 for the top. Even looking at the RSI indicator before using a pattern will give you a little insight into the trend of the price. If the RSI value rises above 70, it means that there is very heavy and voluminous buying in the market. The RSI value of 70 is the last value that the price is healthy, and when the RSI value goes above 70, it is understood that there will be a correction in the price, so if the RSI value is 70 and above, it is a sell signal.
Likewise, 0-30 is a very dangerous value. Consider a low-volume stable coin or a high-volume coin that is constantly under selling pressure. In both scenarios, the RSI value will drop considerably. When the RSI value drops below 30, it is understood that there will be a correction in the price, but this correction is a correction in a good sense. When the RSI value drops below 30, new traders will want to panic sell their coins because of the heavy selling pressure, but this is a buy signal because the price has to return to the healthy range of RSI 30-70.

Explain Rectangle Tops and Rectangle Bottoms in your own words with Screenshots of both patterns.

BNB/BTC pair from tradingview
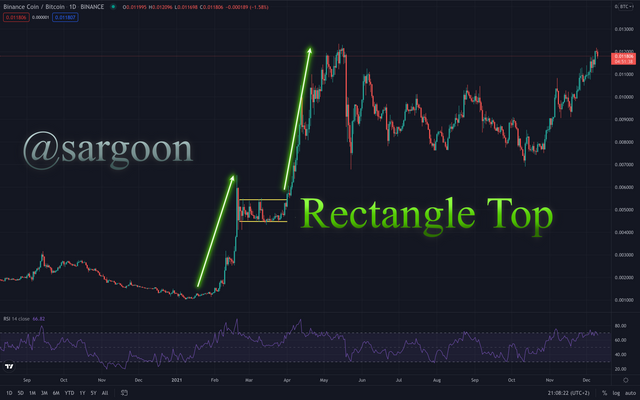
The rectangular top is seen on coins that are moving along a bullish trendline and are still bullish. In cases where the price is already rising and the asset gives a buying signal in volume, with the entry of the sellers into the market, the price of the asset in the uptrend comes to the decision stage and the rectangular pattern emerges.
Rectangular tops are very dangerous because if the price goes too high, it means the RSI indicator exceeds 70 and the price can break out of the support line. If the asset still manages to stay above the support, the price will break the resistance line and a second breakout will occur.

BNB/BTC pair from tradingview
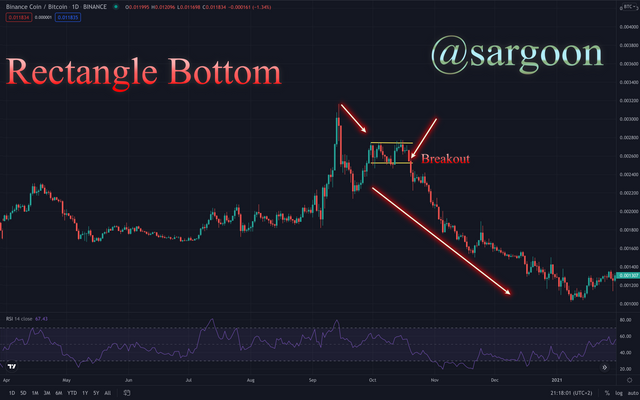
A rectangular bottom is generally seen in coins that are moving along the bearish trend line and have either very low trading volumes or high volume with selling pressure. Indicators and patterns give a clear sell signal as prices are already falling in the market.
In the market, buyers and sellers save the price from the bearish trend and bring it to a stable level, and include it in the rectangular formation. When the price comes to the decision stage, when a movement occurs below the resistance line, the rectangular bottom formation is completed.
Rectangular bottoms are dangerous as they will be subject to high selling pressure. If the first resistance in the rectangle formation is severely breakout, the RSI value may go towards 30. If you do not use a stop loss until the RSI drops to 30, the value of your assets will decrease significantly.

Show full trade setup using this pattern for both trends. ( Entry Point, Take Profit, Stop Loss, Breakout)
Long Position - Buy Setup

BNB/BTC pair from tradingview
In the screenshot above, I created a long position (buy trade) using the rectangular pattern and the RSI indicator. I used the top rectangle pattern and created the rectangle pattern by drawing two parallel lines above and below the candlesticks where the price was a squeeze. The top line of the rectangle represents the resistance trendline and the bottom line represents the support trendline. Since I opened a long position, I created my stop-loss order just below the support trend line.
My entry price is 0.005432 BTC and I set a stop loss at 0.004238 BTC. The 0.01044 BTC price was my exit price where I took my profit.

BNB/BTC pair from tradingview
In the screenshot above, I created a short position (sell trade) again using the rectangular pattern and the RSI indicator, as with the long position. I used the bottom rectangle pattern and created a rectangle pattern by drawing two parallel lines above and below the candlesticks where the price was a squeeze. The top line of the rectangle represents the resistance trendline and the bottom line represents the support trendline. The trend line we need to follow for the short position is the support line. Since I opened a short position, I created my stop-loss order just above the resistance trendline.
My entry price is 0.002511 BTC and I set a stop loss at 0.002802 BTC. The 0.001743 BTC price was my exit price where I took my profit.

Conclusion
The rectangular pattern is a very difficult pattern to determine, but its reliability is quite high. You can earn quite well by using only the rectangular pattern, but I would not recommend using a pattern alone.
Traders should definitely use the rectangular pattern with at least 1 indicator because fake rectangular patterns can mislead new traders. Traders can make successful trades for both short and long positions using the rectangular pattern.
Best regards to Professor @sachin08 for sharing this homework.
Thank you so much for reading my Steemit Crypto Academy post! :)