Crypto Academy Season 4 | Advanced course - Week 5: Onchain Metrics(Part-3)


Background
A public Blockchain is an immutable incorruptible, verifiable & auditable public ledger, and utilizing the Blockchain data one can leverage into the on-chain metrics to make it relatable with the price development of an underlying asset.
The price action may be an explicit thing, but the underlying microstructure of price action always takes cues from the on-chain metrics.
We have so far covered:-
- Week-1: Nos of Active Addresses & Nos of Transactions, HODL Wave & Age of a coin, Exchange inflow and Outflow, NVT Ratio, etc
- Week-3: MVRV Ratio, Realized Cap, Market Cap, etc
This week (Week 5)we will discuss Relative Unrealized Profit/Loss(RUPL) and Spent Output Profit Ratio(SOPR). Both are leading indicators to identify Tops and Bottoms.
- RUPL is used to identify cycle tops & bottoms.
- SOPR is used to identify local tops & bottoms.
Different reliable sites for Onchain Data
The raw approach to obtain on-chain data is to run a node and extract and sample the data to identify a trend/pattern.
But since the birth of Bitcoin, we have already spent a decade in cryptos. So there are different sites/services available as of date to provide you the readymade on-chain data along with novel approaches to analyze it with a proven history.
List of reliable sites for onchain data
Relative Unrealized Profit/Loss
Let's have a recap of Market Cap and Realized Cap before getting into Relative Unrealized Profit/Loss.
The price of an asset multiplied by the circulating supply of the cryptocurrency is known as the Market cap.
Realized Cap refers to the price of the asset when the UTXO was last moved and to obtain the Realized cap we just add up the individual prices of the UTXO and then multiply with the circulating supply.

Source: Glassnode
At any given time, if the asset trades at a price higher than the price when the UTXO was last moved, then it is in profit(floating), similarly, if the asset trades at a price lower than the price when the UTXO was last moved, then it is in loss(floating).
So if we keep on subtracting the realized price from the current price at any given time and adds up all such UTXOs, and weigh it with the total circulating supply of the asset then it will give us either Unrealized profit(a positive value) or Unrealized loss(a negative value).
We can categorize it into two distinct parts:-
- All the positive values (Current price-Realized price) - Unrealized Profit
- All the negative values (Current price- Realized price)- Unrealized Loss
To obtain the behavior of Unrealized Profit/Loss relative to the market cap and relative to time, the Unrealized Profit/Loss is divided by the Market Cap and that gives us the Relative Unrealized Profit/Loss.
Relative Unrealized Profit/Loss(RUPL)= (Market Cap−Realized Cap)/Market Cap
Now let's plot the contour of Relative Unrealized Profit/Loss and relate it with the price action. I will choose BTC to analyze it.

Source: Glassnode
How to read RUPL?
- Every time, RUPL exceeds above 0.75 reading(or 75%) it signifies a top and indicates upcoming profit-taking in the near term. Historic Top.
- Every time RUPL dips below 0.00 reading (or below 0%), it signifies a bottom/accumulation zone. Historic Bottom.
- If we further break it down into different phases or bands, then RUPL will tell us in which stage we are in. The extreme readings are tops or bottoms(Historic). Any reading in between 0% and 75% put you in a particular cycle, either a Bull cycle or a Bear cycle, and the historic readings/range of RUPL validates this thesis.

Source: LookintoBitcoin
Observation:-
On 16th March 2020, the price of BTC was $5014 with the RUPL reading of -0.11%. A reading below 0% always signifies strong support. In a hindsight, it proved that the March 2020 low was a historic bottom for BTC. Since then it has been an upward journey only.
Interestingly, since then RUPL reading has never turned negative. RUPL rose to 75% (or 0.75)on 21st Feb 2021 and since a reading close to 0.75 signals a top, BTC corrected from 64k to 29k. Please note that RUPL is a leading indicator. So any reading close to 75% indicates an upcoming sell-off.

To identify the different stages and to understand the sentiment of the investors/Hodlers in the market, the ranges/thresholds of RUPL is categorized into the following bands:-
- Above 0.75- (Euphoria)
- 0.50 to 0.75- (Greed)
- 0.25 to 0.50- (Optimism- Denial)
- 0.00 to 0.25- (Hope- Fear)
- 0.00 or Below- (Capitulation)
Historically any readings above 0.75 have produced Historic Tops in the BTC. By contrast, any reading below 0.00% has produced historic bottom for BTC.
If we compare the behavior and pattern of RUPL with the macro-cycles of BTC then it is clearly evident that it has optimally identified the cycle tops.
In the previous two cycles, the historic RUPL readings were 87%(the cycle top was $1100) and 78%(the cycle top was $19500) respectively.
In the ongoing bull cycle(since March 2020), the highest reading of RUPL was 75% in Feb, and that resulted in a local correction in BTC, from 64k to 29k. The interesting point to note here is that the RUPL reading has not gone beyond the "greed" zone. And at present, it's trading between 0.25 to 0.5%. Any sustained reading above 0.5% might likely bring fresh ATH to BTC and if it shoots beyond 0.75, it will bring euphoria to the market again.
SOPR(Spent Output Price Ratio)
SOPR is another on-chain metric that is used to identify the local tops (or bottoms), which means the interim tops (or bottoms) within a bull cycle (or bear cycle).
It is defined as the ratio of the sum of the spent value to the created value of the UTXOs.
For an individual, it is simply the ratio of price sold to the price paid. For example, if I buy Bitcoin at 30000 and sold it at 470000, then SOPR= 47000/30000= 1.56
When we calculate the SOPR for an asset and for a period then we take into account all the spent outputs and divide it by the creation value of all the corresponding UTXOs to obtain the SOPR. It can further be standardized wrt a certain period.
Example,
If there are two spent outputs--X & Y. UTXO X has 2 BTC and UTXO Y has 3 BTC. If the created value of UTXO X was 30000 USD, and UTXO Y was 20000 USD. And suppose today both X & Y are sold at a price of 47000 USD, then SOPR can be calculated as:-
SOPR= Price Sold/ Price Paid
Price Sold= (2+3) * 47000= 2,35,000
Price Paid= (2 * 30000) + (3 * 20000) = 1,20,000
SOPR= 2,35,000/1,20,000= 1.96
With SOPR reading greater than 1 signifies that the Hodler or investor is in profit. Conversely, SOPR reading below 1 suggests a loss for the Hodler or investor.
Now let's plot SOPR and relate it with the price development of BTC.

Source: Glassnode
How to read SOPR?
- When SOPR deviates significantly above 1, it creates a local top.
- When SOPR deviates significantly below 1, it creates a local bottom.
- In a Bull cycle if the SOPR reading approaches 1 or just around 1, then it is a Buy signal.
- In a Bear cycle if the SOPR reading approaches 1, then it is a sell signal.

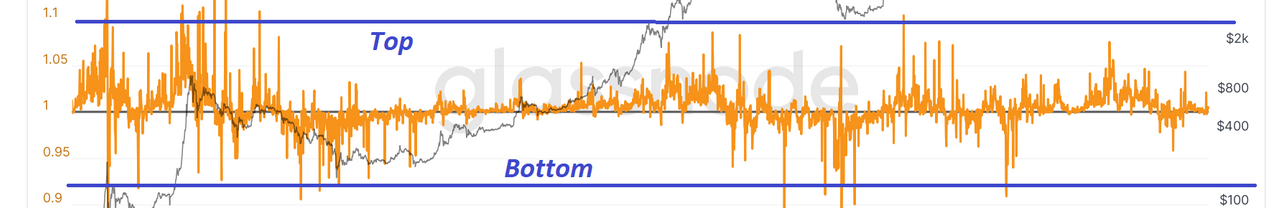
The last major bottom of this ongoing Bull cycle happened in Mar 2020, and that also accompanies a downward spike of SOPR with a reading of 0.94, the upward spike in SOPR in the ongoing Bull cycle is somewhere around 1.06.
Note- Even though 5000 level was a cycle bottom( or the low of the ongoing Bull cycle), SOPR should not be used to identify cycle bottom, it should be used only for local tops and bottoms. For cycle tops and Bottoms the appropriate indicator is RUPL.
If we take the historic range of SOPR, then more or less it is confined within a range of 0.9 to 1.1, with 1.0 being the neutral zone. The downward spikes have always found a bottom and the upward spikes signify a local top. So taking into account this historic range, we can suitably identify the local tops and bottoms. However, to optimally identify the top and bottom it should be used in combination with other indicators.
Usefulness and Limitations:-
- The use of both RUPL and SOPR might produce distorted results in the short term and you might not get a clear picture. Further, since the calculation are based on UTXO, it may work only for UTXO based chains.
- Both the indicators won't work for private chains.
- RUPL works excellent if used in combination with MVRV to identify a cycle top. RUPL has produced proven results for cycle tops, so its reliability is for long-term purposes. Day traders might not benefit from this indicator.
Homework Task (Season 4/ Week-5)
(1) How do you calculate Relative Unrealized Profit/Loss & SOPR? Examples? How are they different from MVRV Ratio(For MVRV, please refer to this POST)?
(2) Consider the on-chain metrics-- Relative Unrealized Profit/Loss & SOPR, from any reliable source(Santiment, Glassnode, LookintoBitcoin, Coinmetrics, etc), and create a fundamental analysis model for any UTXO based crypto, e.g. BTC, LTC [create a model to identify the cycle top & bottom and/or local top & bottom] and determine the price trend/predict the market (or correlate the data with the price trend)w.r.t. the on-chain metrics? Examples/Analysis/Screenshot?
(3) Write down the specific use of Relative Unrealized Profit/Loss(RUPL), SOPR, and MVRV in the context of identifying top & bottom?
Guidelines
- Your article should be at least 500 words.
- It is always better to gain sufficient user experience before submitting your article.
- Refrain from spam/plagiarism. This task requires screenshot(s) of your own experience. Use images from copyright-free sources and showcase the source, if any.
- This homework task will run until 9th Oct'2021, Time- 11:59 PM UTC.
- Users having a reputation of 65 or above, and having a minimum SP of 600(excluding any delegated-in SP, delegating to vote-buying services is viewed negatively) are eligible to partake in this Task. (Must not be powering it down).
- Add tag #sapwood-s4week5 #cryptoacademy in your post and should be among the first five tags. You can also use other relevant tags like #blockchain #onchainmetrics #fa or any other relevant tag. And also make sure you post in the Steemit Crypto Academy community.
- Do not reproduce the information that I have provided in my course article. Expand your knowledge by extensive research & analysis with proper reasoning to chainlink your understanding.
- Your homework title should be On-chain Metrics(Part-3)- Steemit Crypto Academy- S4W5- Homework Post for @sapwood
(Please feel free to join the comment section if you have any doubt on Homework-Task)
Thank you.
Disclaimer
This article & analyses are for education purposes only and should not be viewed as investment advice. This does not guarantee or promise in regards to any result that may be obtained from using the above content. The information provided here is for educational purposes in Steemit Crypto Academy. No person should make any kind of financial decision without first consulting their own financial adviser and/or conducting their own research and due diligence.
Cc:-
@steemitblog
@steemcurator01
@steemcurator02
Hello sir @sapwood thank you for such an insightful lecture my entry coming up shortly. I have a question though not about this topic. My tron account address is TET4CjKTS1VvsoJRQxrn2Qch7gsF2nxA3U but seems i cant find the private key anymore. I linked the account to a new tron account but the asset in the account didnt show up in my new account. Please i need help if there is anything i can possibly do about it.
You dont have the private key for this account- TET4CjKTS1VvsoJRQxrn2Qch7gsF2nxA3U
????
If NO, then there is no chance you can restore it.
If yes, then you can easily restore and get access to your fund again.
Your new STEEMIT integrated TRX account ending with "CK4" is showing a balance of 33 TRX.
Yes.
Should i delete the account as some of my claim is still going into the account.
No need to delete it. Let the new account(assuming you have the private key of the new account too) generate TRX rewards.
For the old account, go to TronLink and add or restore your old account, you can access your TRX rewards.
This is not too clear sir. Please i need more light.
hello professor. The first question is a bit confusing.
I take it as your intent was to write "why" here?
Actually, it is "How".
Thanks for the proofreading. Now corrected.
Alright, you're welcome
Wonderful prof. I think I'm beginning to understand the metrics more. Thanks for the lectures prof.
Thank you.
Hello professor,
In Question 2, are we to perform long term and short term analysis ?
Not mandatory, it's up to you. However, if you want to check the usefulness of it in the short term, you can.
Thank you.
Hello Professor
I think it is a type of mistake. It should be March 2020.
I enjoyed the sessions and also waiting for part 4 on On-chain metrics.
Thanks for the proof-reading.
Now corrected.
My Pleasure Professor :-)
This is totally unrelated, but I hope to get your help regarding this.
This post has been long overdue and the professor in charge didn't even check not to talk of marking it. It's past payout date already and I posted the same link under his page last week but it's still unattended to.
https://steemit.com/hive-108451/@olawalium/nft-markets-crypto-academy-s4w3-homework-post-for-imagen
Thank you.
We apologize for the inconvenience caused to you. We request you to make a REPOST of this assignment and include the word REPOST in the title and tag the professor.
It will be taken care of.
Thank you.
Cc: @imagen
Thanks a lot for this.
.
It would be pretty cool if you could message someone without commenting on a post. Private message is sort of misleading because it’s not private due to being on the blockchain.
Hello! Excellent explanation, one question: do I have to have participated in the two previous parts to be able to do this third part? Greetings!
No. There is no such condition for this Task.
Thank you.
Thank you, Prof .. assignment submitted:
https://steemit.com/hive-108451/@olawalium/on-chain-metrics-part-3-steemit-crypto-academy-s4w5-homework-post-for-sapwood
Hello sir @sapwood am still having issues with my tron account, the rewards i claim this days does not show up. Please if there is anyway you can guide me to get the claims reflecting i will deeply appreciate. Morealso, i will love to have a chart with you on discord if you don't mind. Please relate me your ID. Thanks