Ultimate oscillator indicator- Steemit Crypto Academy- S5W8-Homework post for @ utsavsaxena11
Question 1
What do you understand by ultimate oscillator indicator, how do you calculate ultimate oscillator value for a particular candle or timeframe, showing real examples.
The Ultimate Oscillator Indicator
The ultimate oscillator indicator is a leading indicator classified under the momentum based idicators. The technical indicator was created by the famous Larry Williams in the year 1976. With its momentum nature, it is used to measure the momentum of assets wit crypto assets inclusive.
The indicator is noted to have less volatility in providing signals which in accordance provides lesser signals when compared to other momentum based indicators. This is because it does not rely on a particular or a single time frame in providing signals but it rather takes into consideration the usage of multiple timeframe to filter out false signals.
Just like the other momentum based indicators, the ultimate oscillator indicator identifies two potentials zones;
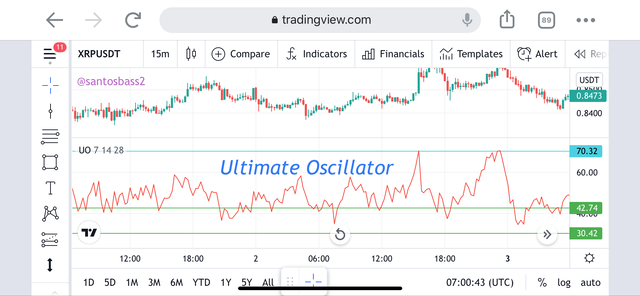
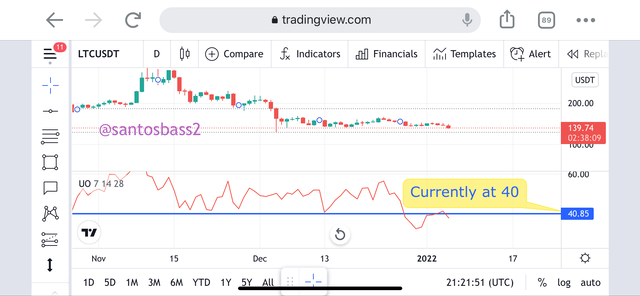
It identifies overbought areas when we have the indicator trending above the 70 level line which shows buyers are getting exhausted in that particular security.
And we have oversold areas when we have the indicator line trending below the 30 level line which shows sellers are getting exhausted in the particular security.
Calculating the ultimate oscillator indicator
Beginning by stating the ultimate oscillator indicator formula, we calculate using the formula below;
UO = [[((A 7 * 4) + (A 14 * 2) + (A 28 )) / 7] * 100]
Where;
- UO is representing the ultimate indicator
- A 7 is representing the average of the 7 period
- A 14 is representing the average of the 14 period
- A 28 is representing the average of the 28 period
Now calculating each of the unknown.
- A 7 is given by the = sum of the BP last of 7 days / sum of TR for the last 7 days
- A 14 is given by the = sum of the BP last of 14 days / sum of TR for the last 14 days
- A 28 is given by the = sum of the BP of last 28 days / sum of TR for the last 28 days
Where TR = true range
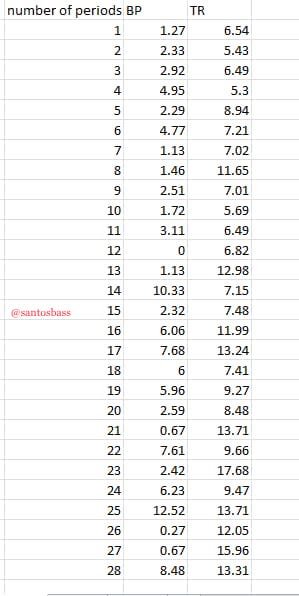
Calculating now the buying pressure and the true range;
The buying pressure is given by = current close –min(previous close or current low)
The true range is given by = max (previous close or current high) - min(previous close or current low)
Example Calculation
I will begin by calculating the buying pressure and the true range using the formulas above. This is shown in the excel sheet below.
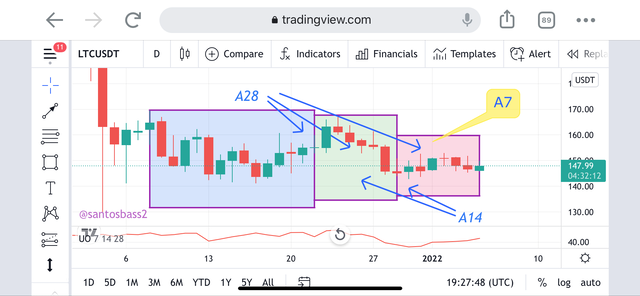
I now use the formula as stated below to calculate the A 7 , A 14 , A 28 as below
A 7 = 19.66 / 46.93 = 0.42
A 7 = 39.92 / 104.72 = 0.38
A 7 = 109.4 / 268.14 = 0.41
Using the main equation now to calculate the ultimate oscillator,
UO = [[((A 7 * 4) + (A 14 * 2) + (A 28 ))/7] * 100]
= [((0.42 * 4) + (0.38 * 2) + (0.41 )) 7] * 100
(1.68 + 0.76 + 0.41) / 7
0.4 * 100 = 40.7
UO = 40.7

Question 2
How to identify trends in the market using ultimate oscillator. What is the difference between ultimate oscillator and show stochastic oscillator.
Identifying Trends using ultimate oscillator
We can identify trends in the prices using the ultimate oscillator as it thus finds potential overbought and oversold areas in the prices. The indicator has two main lines which are the 70 level and the 30 level. Crossing the 70 level will indicate and overbought and crossing the 30 level will indicate an oversold. I will explain each of them below.
Identifying Uptrends with Ultimate Oscillator
Beginning with the identification of an uptrend with the ultimate oscillator, the technical indicator identifies an uptrend when we have the crossing of the indicator above the 70 level. Crossing this level indicates an overbought as the buyers are getting exhausted purchasing that particular asset. With this, it shows the bulls are gradually taking over the market which will mark the beginning of an uptrend as explained in the chart below.
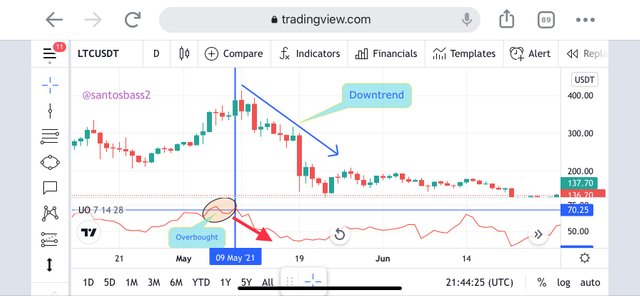
Identifying Downtrends with Ultimate Oscillator
To continue now with the identification of a downtrend with the ultimate oscillator, the technical indicator identifies a downtrend when we have the crossing of the indicator below the 30 level. Crossing this level indicates an oversold as the seller’s are getting exhausted selling that particular asset. With this, it shows the bears are gradually taking over the market which will mark the beginning of a downtrend as explained in the chart below.
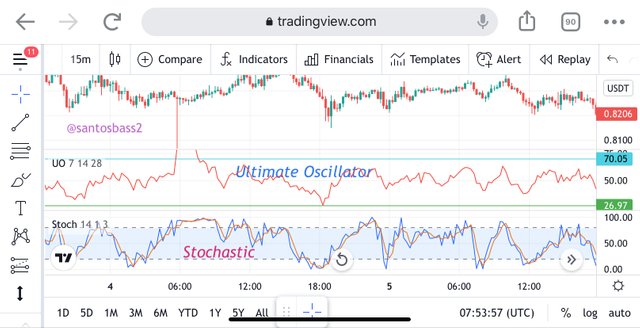
The stochastic indicator has two oscillator lines while the ultimate indicator has just a single oscillator line.
The stochastic indicator normally uses the 80 and the 20 level while the ultimate indicator uses the 70 and the 30 levels too represent overbought and oversold areas
The ultimate indicator makes into analysis the usage of 3 different periods in its calculations which are the 7, the 14 and 28 while the stochastic indicator uses the 14 and the 3 periods.
The ultimate indicator is none to produce fewer signals though they tend to be more effective while the stochastic produces many signal which will mostly need to need of confluence to filter out false signals.
Question 3
How to identify divergence in the market using ultimate oscillator, if we are unable to identify divergence easily than which indicator will help us to identify divergence in the market.
Identifying Divergence using the ultimate oscillator indicator
Bullish Divergence
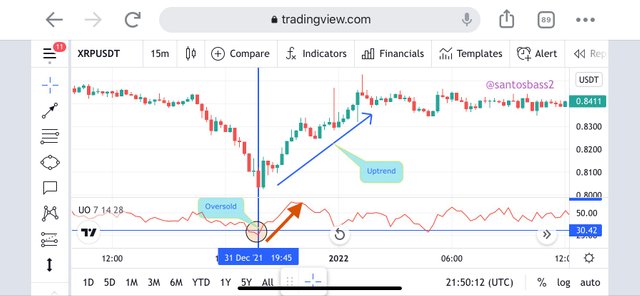
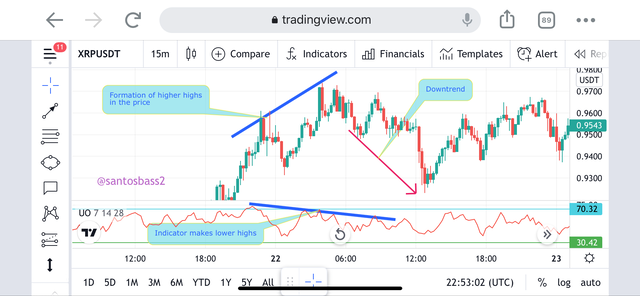
The bullish divergence with the ultimate oscillator is formed when we have the formation of lower lows with the price movement while the indicator is showing a movement with the formation of higher lows as it moves upward. In the chart below, we can see the formation of lows in the prices of the xrp/usdt while the indicator moves in an uptrend with the formation of higher lows which indicates a trend reversal from the current downtrend to an uptrend. This is shown below.
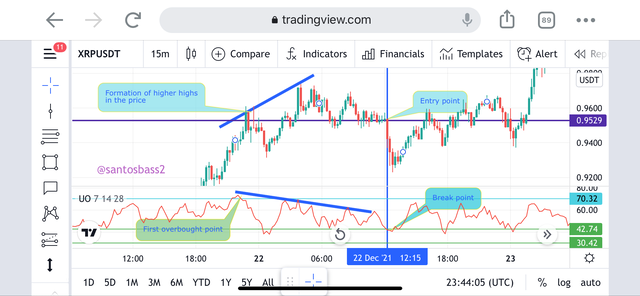
Bearish Divergence
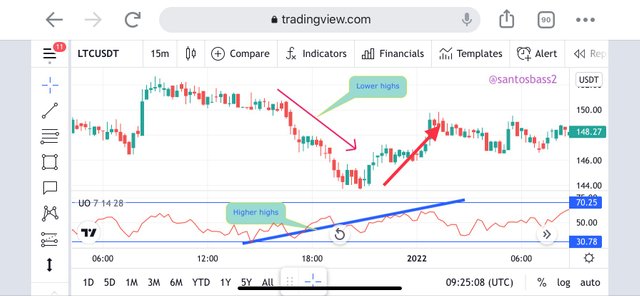
The bearish divergence with the ultimate oscillator is formed when we have the formation of higher highs with the price movement while the indicator is showing a movement with the formation of lower highs as it moves downward. In the chart below, we can see the formation of higher in the prices of the xrp/usdt while the indicator moves in a downtrend with the formation of lower highs which indicates a trend reversal from the current uptrend to a downtrend. This is shown below.
Other indicator to help us find divergence
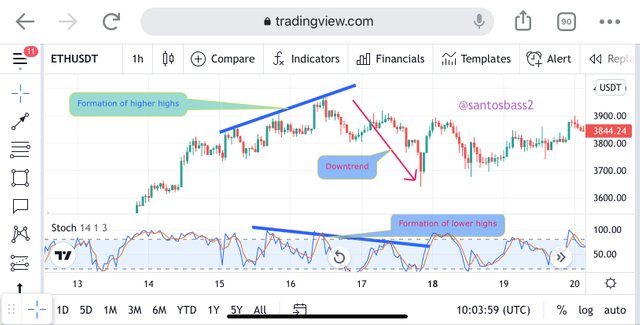
If we can’t find a divergence in the market, a preferable indicator to use is the stochastic indicator or the relative strength indicator as it does identifies areas of overbought and oversold through the formation of higher highs and lower highs respectively.
In this regard we can find this areas of bullish and bearish divergence as I will be demonstrating in the chart below.
Question 4
What is the 3 step approach method through which one can take entry and exit from the market. Showing real examples of entry and exit.
The 3 step approach for buy and sell trading
1) Buy Entry and Exit
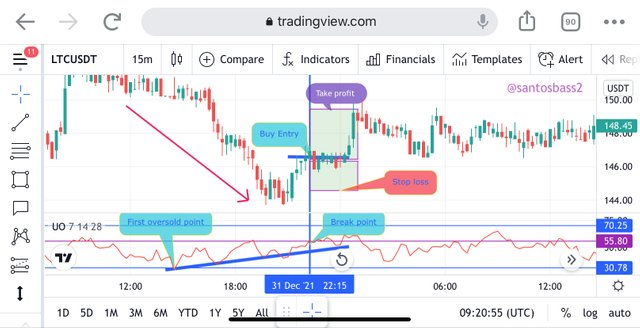
I will use the 3 step approach to demonstrate the entry and exit points for buy positions. For the 3 step approach, we must follow the following points as listed below;
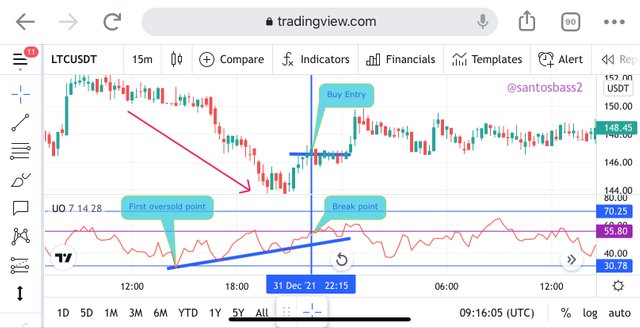
I begin by identifying the bullish divergence since I am finding a buy entry. In the bullish divergence, we will see the formation of higher highs with the ultimate indicator while we see the formation of lower highs with the prices.
The second step here is the identification of the first lower low point which has to be below the 30 level. As it does indicates the start from the oversold condition which will soon take an uptrend.
The third step now is the rising of the ultimate oscillator above the divergence high point which is between two lows of the divergence.
Trade Exit
The trade exit is about setting proper stop loss and take profit levels. The stop loss will be set some few pips above the recent swing high point while the take profit will be set using the take profit level in a risk to reward 1:1.5
2) Sell Entry and Exit
Sell Entry
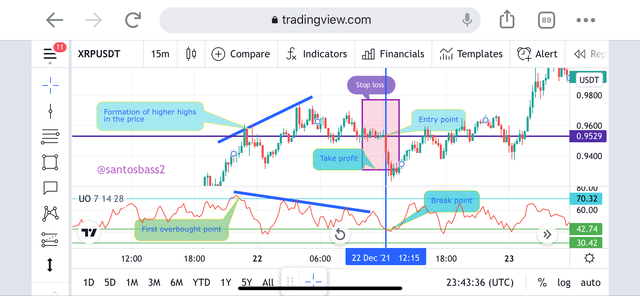
Using the 3 step approach to demonstrate the entry and exit points for sell positions. For the 3 step approach, we must follow the following points as listed;
I begin by identifying the bearish divergence since I am finding a sell entry. In the bearish divergence, we will see the formation of lower highs with the ultimate indicator while we see the formation of higher highs with the prices.
The second step here is the identification of the first higher high point which has to be above the 70 level. As it does indicates the start from the oveboughtt condition which will soon take a downtrend.
The third step now is the falling of the ultimate oscillator below the divergence low point which is between two highs of the divergence.
Trade Exit
The trade exit is about setting proper stop loss and take profit levels. The stop loss will be set some few pips below the recent swing low point while the take profit will be set using the take profit level in a risk to reward 1:1.5
Question 5
What is your opinion about ultimate oscillator indicator. Which time frame will be preferable to use ultimate oscillator and why
My Oppinion about the ultimate oscillator
I can say with the practice done so far with the ultimate indicator, we can say the indicator can be relied on as it does allows provides signals with great accuracy. With the usage of the bullish and the bearish divergence, it is true that the probabily of getting a signal will really increase.
One the drawback of this indicator is just it provides signals very slowly, for this reason, you will need to wait for a quite long time before getting a signal. And it is also important to use this indicator with confluence with other indicators such at the Bollinger bands and the exponential moving average.
The indicator will particularly be useful for scalper traders than swing traders. This is because, the indicator first by it self is very slow in providing signals and means if used by a swing trader then it will normally take a vey long period before ever getting a signal buy at least a scalper trader will get a few signals during the day.
Conclusion
I have explained the ultimate oscillator indicator which is a technical indicator used as a momentum based lagging indicator in finding overbought and oversold regions in the prices when we have the prices above the 70 and the 30 levels respectively.
I have also demonstrated the calculation of the calculation of this indicator using the 7, the 14 and the 28 periods. The indicator is quite useful in fining entry and exit points when using the bullish and the bearish divergence with the prices.