Trading strategy with the VWAP indicator - Crypto Academy/S5W3 - Homework post for @lenonmc21
QUESTION 1
Explain and define in your own words what the VWAP indicator is and how it is calculated
The VWAP Indicator
Definition
The VWAP stands for Volume-Weight Average Price. It is an indicator that takes into account three main specifications which are the;
- Volume
- The price
- And the number of daily candle
So in vivid definition, we see the VWAP to be the average price of an asset which is weighted by its volume. In this case, we see that we can get the specific areas in which the liquidity levels is set on by the buyers and the sellers.
Well, the volume weight average price indicator is particularly useful for short term traders. This is because we the calculation of the indicator based on when the market opens to when the maket closes.
We see that with the volume weight average price we can easily find entry and exit points in the market with much and higher probability.
Explaining again, the vwap is known to behave like the moving average though it happens to be more complex. The indicator can be used for trend identification. If the prices are above the vwap, then it is an indication of a bullish phase, and if the prices are below the vwap it is bearish trend. I will further explain it’s usage below, as we can combine with the Fibonacci tool to get high probability entry levels.
Calculations
The calculation of the VWAP indicator Is quite simple and straight forward. I will begin by stating the formula then moving to the example calculation.
The formula is thus;
VWAP = price X volume / cumulative volume.
The above formula is the main formula used for its calculation. To get there, we have 5 steps which I will be showing below.
The five steps are:
Calculating the Typical Price for the said period, given by;
(high + low + close) /3
Multiplying the Typical Price with the period Volume which is given by;
Typical Price * Volume
Creating a Cumulative Total for Typical Price, given by;
Cumulative * (Typical Price * Volume)
Creating a Cumulative Total of Volume given by;
Cumulative * Volume
Dividing the Cumulative Totals which is given by;
VWAP = Cumulative {Typical Price * Volume} / Cumulative*Volume
Example
Lets take for instance the following figures on a day trade
H = 21
L = 16
C = 19
V = 24
CV = 75
Therefore the price will be
21 + 16 + 19 / 3 = 15.3
And
VWAP = 15.3 * 24 / 75
= 4.9

QUESTION 2
Explain in your own words how the strategy with the VWAP indicator should be applied correctly
Applying the VWAP Indicator
I will be using the trading view platform for the explanation of the application of thee VWAP indicator.
What we have to do is note 3 key points which are, finding the breakdown of the structure which is either from bearish to bullish or from bullish to bearish, using the Fibonacci tool to find the retracement of the prices back to the VWAP indicator, and finally finding an entry position with the correct management. I wil then explain each of them below in detail.
a) Bullish and Bearish Breakdown of structure.
The first step here is finding the breakdown structure which is the breaking of the last high made by the prices in a bullish trend or the breaking of the last low in the case of a bearish trend.
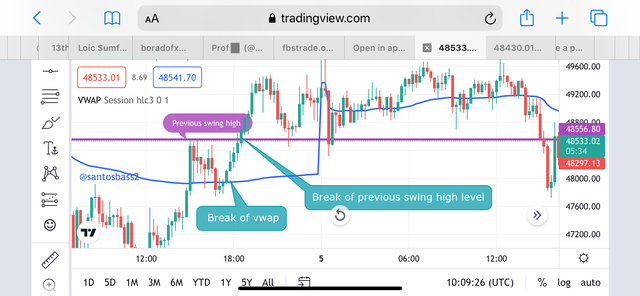
We note that the validity of this is taken into consideration when we have the breaking VWAP indicator. We can see the better explanation in the setup above.
b) Using the Fibonnacci tool to find retracement
The second thing here is using the Fibonacci retracement tool to find the correction levels. Using the fibonnacci retracement is quite simple. All we got to do is in the case of the bullish trend we click on the lowest low of the trend and drag to the swing high we had after the breakout. And in the case of a bearish trend, we click on the highest swing high and drag to the swing low position we had after the breakout.
With this, we will be measuring the momentum of the prices as the prices approach the 50% level and the 61.8%.
c) Finding correction management for entry position
For the correction management, this is where we will be finding the entry and exit positions. We will be looking at closely as the prices reach the 50% and the 61.8% levels. The stop loss then will be set some few pips below thee 50 and the 61.8 levels which are acting as liquidity levels. And also the take profit level will be set using stop loss level in risk to reward based on trade management which is preferred as 1:2 as maximum.

QUESTION 3
Explain in detail the trade entry and exit criteria to take into account to currently apply the strategy with the VWAP
Buy Order Entry
Trade Entry
For the buy entry criteria, we will be using the first two aforementioned points in the previous question. It means here that, we will be looking at the structure breakdown from bearish to bullish since we will be entering a buy order. This will mea the prices will break the indicator and the previous swing high position made.

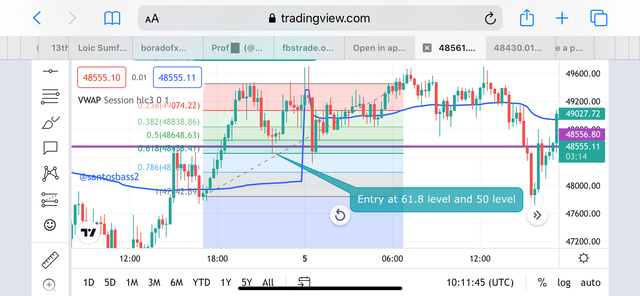
After this, we will see use the Fibonacci indicator to find the entry position as we wait for the prices to retrace back to the 50 or the 61.8% level. Here, we can clearly enter the buy order.
Trade Exit
For the trade exit, it will be about setting potential stop loss and take profits levels. Since the prices have reach the 50% and 61.8% zones, we can now place the stop loss below the 50 and the 60% zones. The take profit level is set with a risk to reward ratio of 1:1.5
Sell Order Entry
Trade Entry
For the trade entry criteria, i will be using the first two aforementioned points just as above. It means here that, i will be looking at the structure breakdown from bullish to bearish. Since we will be entering a sell order here. This will mean the prices will break the indicator and the previous swing low position made.
After this, we will see use the Fibonacci indicator to find the entry position as we wait for the prices to retrace back to the 50 or the 61.8% level. Here, we can clearly enter the sell order.
Trade Exit
For the trade exit, it will be about setting potential stop loss and take profits levels. Since the prices have reach the 50% and 61.8% zones, we can now place the stop loss above the 50 and the 60% zones. The take profit level is set with a risk to reward ratio of 1:1.5
QUESTION 4
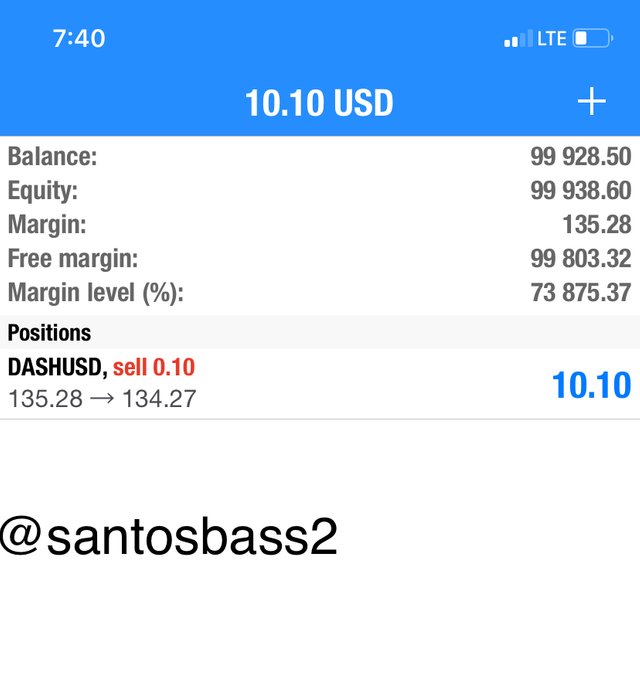
Make 2 entries using the strategy with the VWAP indicator. These entries must be made in a demo account, keep in mind that it is not enough just to place the images of the entry, you must place additional images to observe their development in order to be correctly evaluated.
Buy Order Entry
Trade Entry
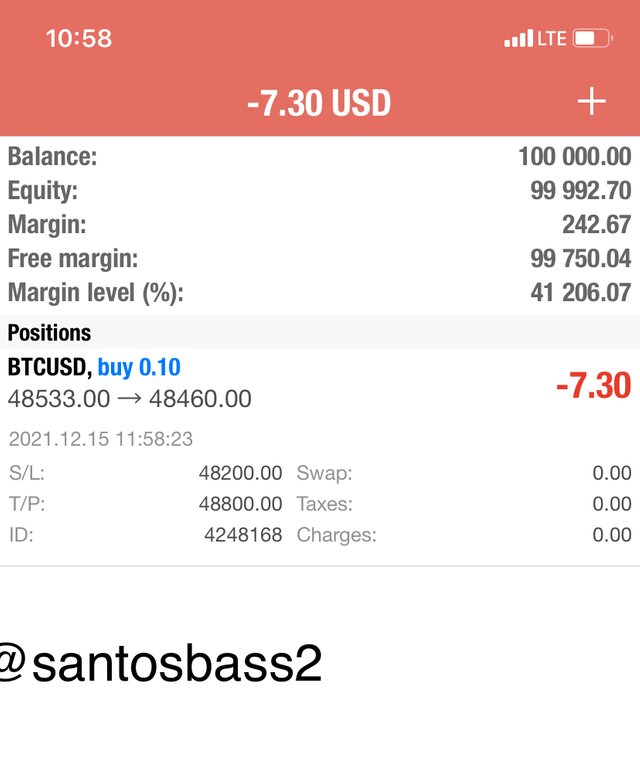
The trade entry will be for the btc/usd pair.
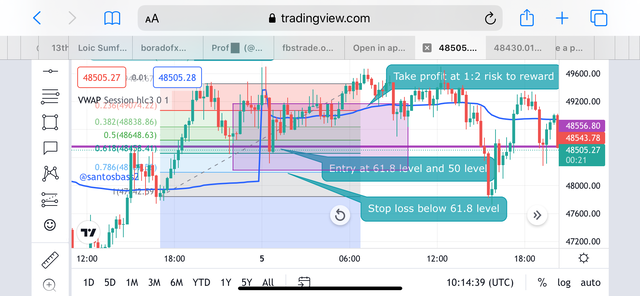
For the buy entry, I will be using the first two aforementioned points in the previous question. It means here that, i will be looking at the structure breakdown from bearish to bullish.
This will mean the prices will break the indicator and the previous swing high position made. We can see in the setup below.
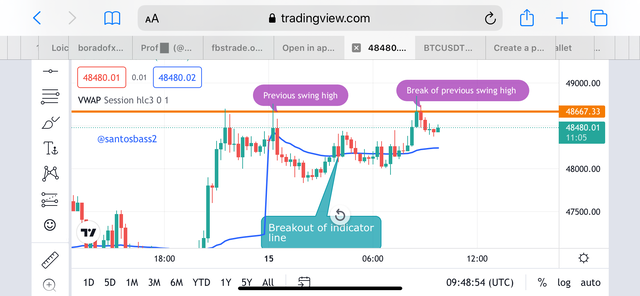
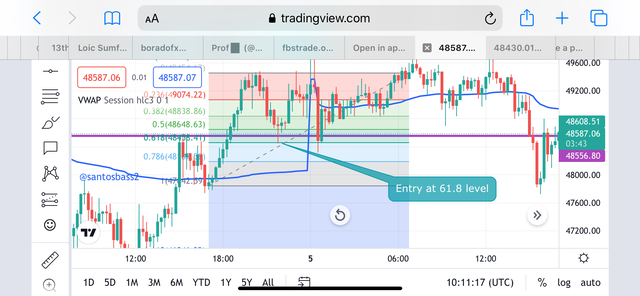
After this, i am using the Fibonacci indicator to find the entry position as i wait for the prices to retrace back to the 50 or the 61.8% level. Here, I can clearly enter the buy order.
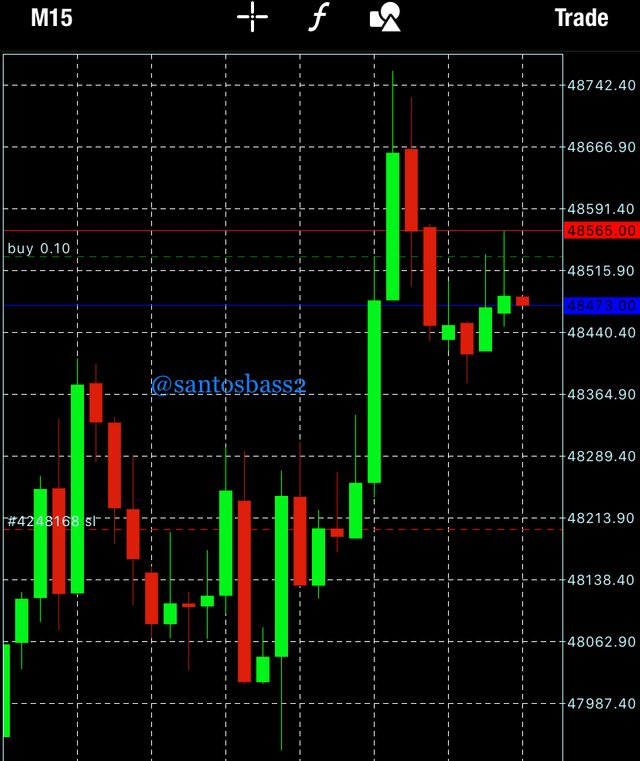
Trade Exit
For the trade exit, it will be about setting the stop loss and take profits levels. Since the prices have reach the 61.8% zone, i can now place the stop loss below the 61.8% level. The take profit level is set with a risk to reward ratio of 1:1.5

Sell Order Entry
Trade Entry
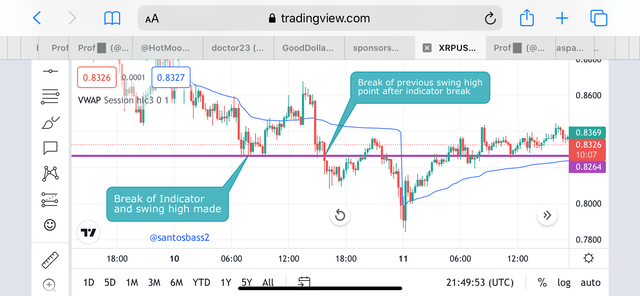
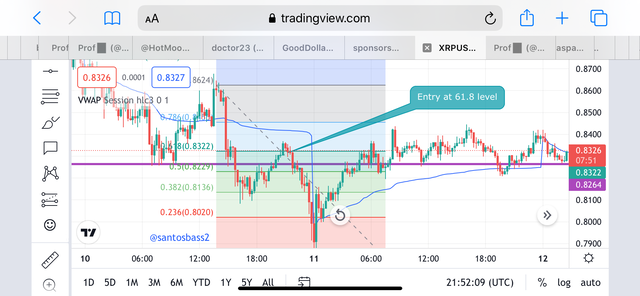
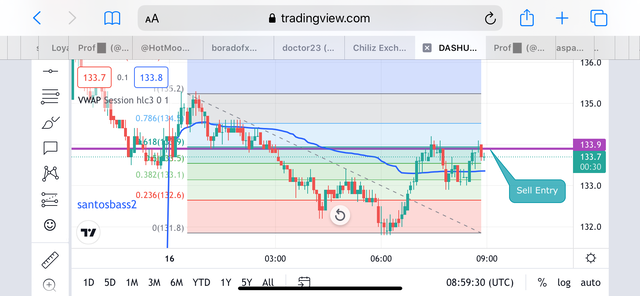
For the trade entry criteria, i will be using the first two aforementioned points just as above with the dash/usdt pair. It means here that, i will be looking at the structure breakdown from bullish to bearish. Since we will be entering a sell order here. This will mean the prices will break the indicator and the previous swing low position made.
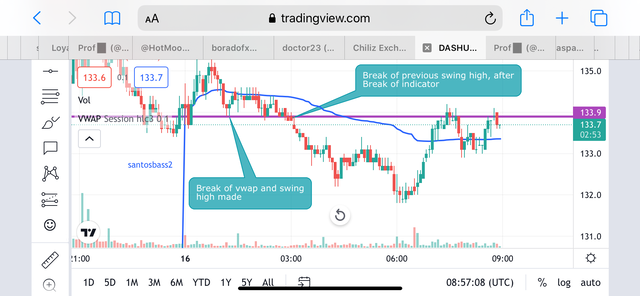
After this, i use the Fibonacci indicator to find the entry position as we wait for the prices to retrace back to the 50 or the 61.8% level, and the level here is the 61.8 level. I canyhen enter the sell order.
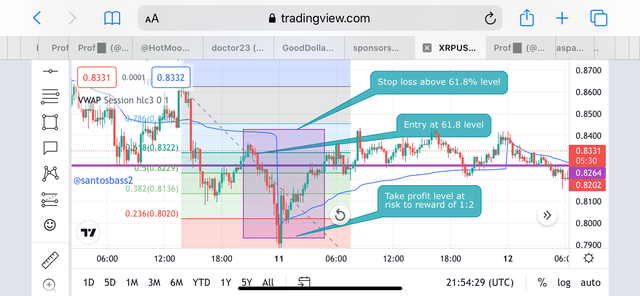
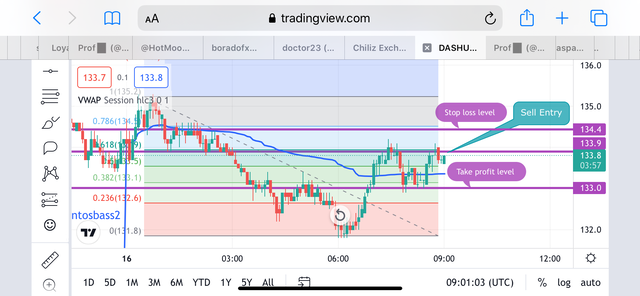
Trade Exit
For the trade exit, it will be about setting potential stop loss and take profits levels. Since the prices have reach the 50% and 61.8% zones, we can now place the stop loss above the 61.8 level. The take profit level is set with a risk to reward ratio of 1:1.5
Conclusion
The volume weighted average price shows the potential true average price of an asset. the indicator can show relative buy and sell zones with high probability. This means that when the market is bullish, we have the prices below the indicator and bearish when we have the prices below the indicator.
We can further increase the chances and probability by adding the Fibonacci tool to find the entry positions in the 50% and the 61.8% zones.
All screenshot are my analysis from tradingview.com