Trading Strategy with Median Indicator - Steemit Crypto Academy |S6W4| - Homework Post for Professor @abdu.navi03


explain your understanding with the median indicator
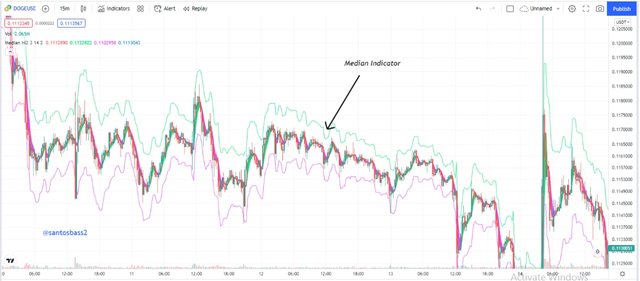
The Median Indicator
The usage of indicators for trading has been known to increase the increase the winning chances of the signals being produced thereby increasing profitability as well. In this light, I will be introducing the median indicator which happens to be a trend based technical indicator.
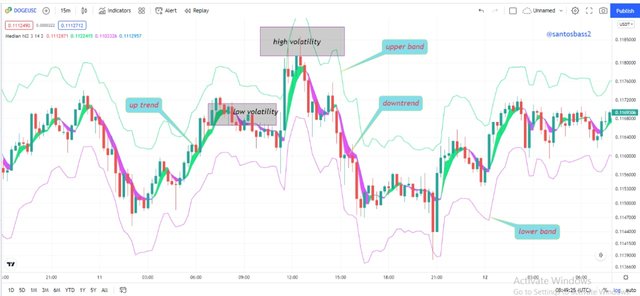
The median indicator as earlier mentioned is a trend based indicator which is used to catch the direction of a trend well ahead of time. The indicator is known to measure the direction and volatility of the prices of a particular asset. This means the median indicator displays the values of the highs and the lows in a specific length of the chart.
Let’s take a brief description of the indicator, the indicator is developed based on the average true range which I will be describing the parameters and its calculations in-depth below.
The indicator is made up of thick median line which acts as a moving average buy showing the bullish and the bearish nature of the prices. This then happens when we have the producing of a bull market when we have green colour display and a purple colour when we have a bear market indication.
This means we will have the production of a green band when we have the median line above the EMA, while we have the purple band when we have the median line below the EMA which is made up of the same length.
parameters and calculations of median indicator
The Parameters and calculations of the median indicator
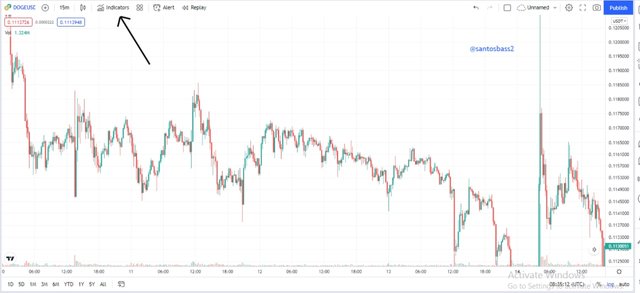
Let me begin by adding the median indicator to our chart before showing the various parameters and its calculation.
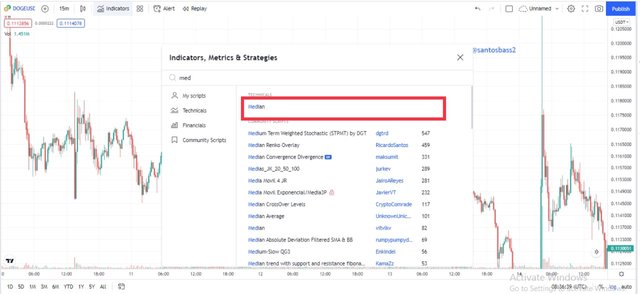
I will use the tradingview platform to add the median indicator. We begin by login into the tradingview.com platform. And on the indicator window, we click on Indicator
Then on the search bar, we search Median where we click on it and its automatically added to the chart.

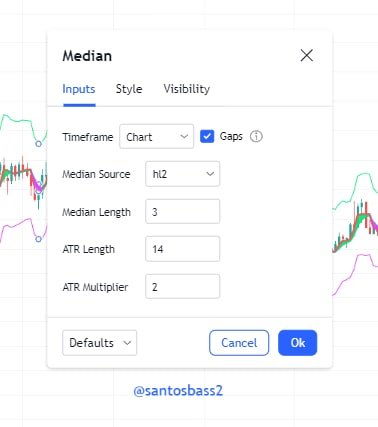
Parameters
The main parameters of the median indicators are as listed below;
The Median Source
Beginning with the median source, it acts as a data source which the median relies on for its calculation
The Median Length
The median length, shows the number of data points of the source in particular which it is being used to calculate the median indicator.
The ATR Length
The ATR length displays the time period which its being used in the calculation of the median indicator
The ATR Multiplier
Concluding with the ATR multiplier, it displays the value in which the Average True Range is multiplied before the formation of the bands.
From the parameters above, we are going to leavev everything to default which are;
- median source to hl2,
- median length to 3
- ATR length to 14
- ATR multiplier to 2
Calculations
For the calculations the formula is as below;
The Median Indicator = Percentage of ATR (median value, EMA value)
Therefore, we need to calculate the median value and the EMA value.
Median Value = (HP + LP) / 2
EMA Value = (CP x multiplier) + EMA (previous day ) x (1-multiplier)
Where;
CP = Closing price
HP = Highest Price
LP = lowest Price
Therefore:
When we have the EMA percentage change >= median value, the plot is purple
When we have the Median percentage change >= EMA value, the plot is green
uptrend from median indicator
Identifying Uptrend with Median Indicator
The median indicator being a trend indicator, it signifies we can easily locate the trend of the market with the usage of the indicator.
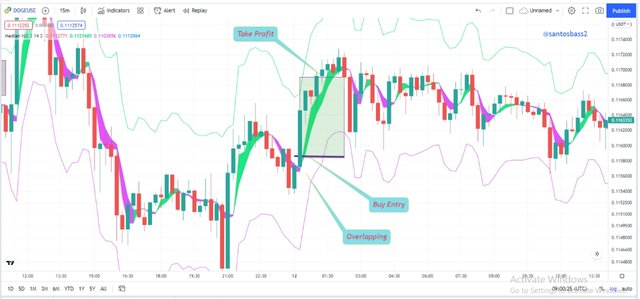
From the screenshot above we have the addition of the median indicator, the uptrend is seen when we just have a change of the band to a green colour which indicates a buy order. Another aspect of this indicator is the setting of the stop and take profit level.
The stop loss and take profit is triggered manually when we have a change of the colour of the band. This means using the median indicator you must not be an emotional trader especially in the aspect of greed.
downtrend from median indicator
Identifying Downtrend with Median Indicator
Just as in the case above, the median indicator can also be used to catch the beginning of a downtrend. This usage is the exact opposite of the above formation.
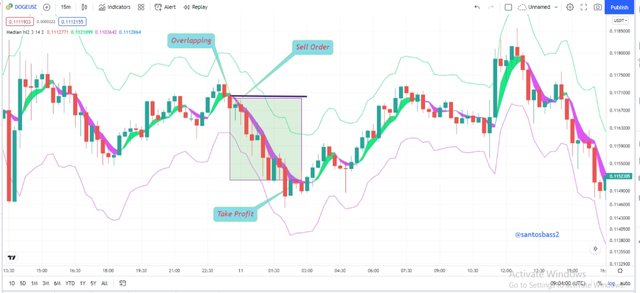
From the formation above, we have a downtrend formation when we have the change of colour of the band from green to purple. At the change of this colour, we can place a sell order. The exit of this position is done manually as we wait for the change of the colour of the band to exit the position.
identify false signals with median indicator
Identifying False Indicators with Median Indicator
An interesting aspect of the median indicator is that we can use it to identify false signals from other indicators. An example of the indicator I will be using is the stochastic and the relative strength index indicator.
Beginning with the Relative Strength Index Indicator, we can see from the above formation an indication of a bearish through the purple formation.
Normally, with the relative strength index indicator, we have a buy order when we have the indicator line below the 30 level and sell when it’s above the 70 level which shows oversold and overbought respectively.
From the formation we have an oversold which gives a buy order yet the trend keeps falling.
Now with the stochastic indicator, we have a buy during an oversold located below 20 level and a sell when we have the indicator above 80 level indicating an overbought. From the above formation we have a sell order from stochastic but the trend-based median indicator keeps showing a green band for a buy.
open two demo trades, long and short with the help of the median indicator
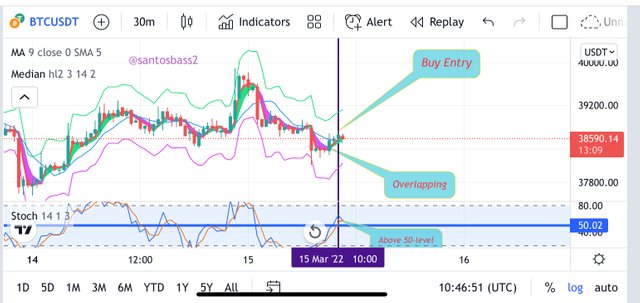
Using Median Indicator to Buy Btcusdt
My buy Entry will be done with the median indicator and the stochastic indicator.
The stochastic indicates a bullish trend when we have the indicator line above the 50 level and a bearish when we have the indicator below the 50 level. In this case, we have the stochastic above the 50 level indicating a bullish trend.
The median indicator further supports the signal as we have the appearance of a green color.
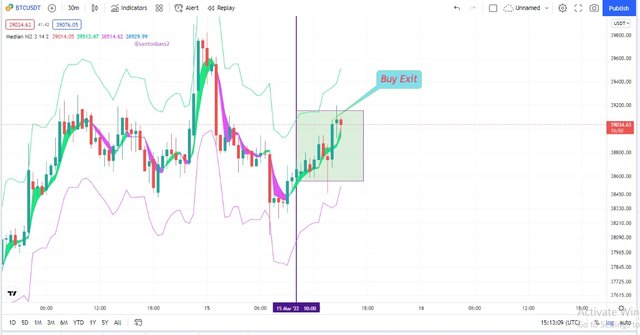
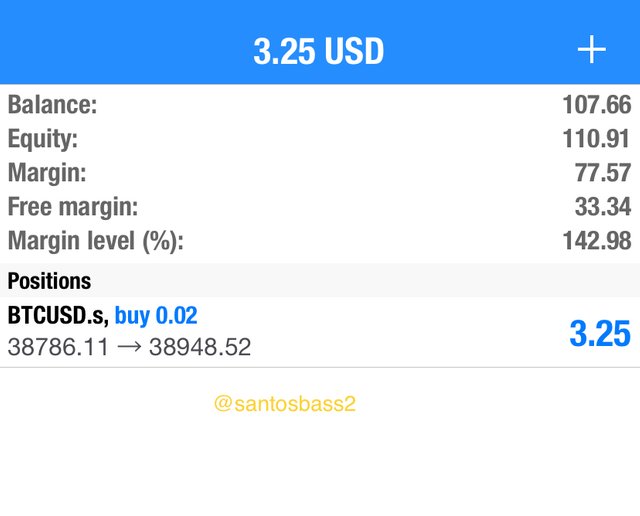
A buy order is then taken, then I wait to manually close the trade on appearance of a purple colour.
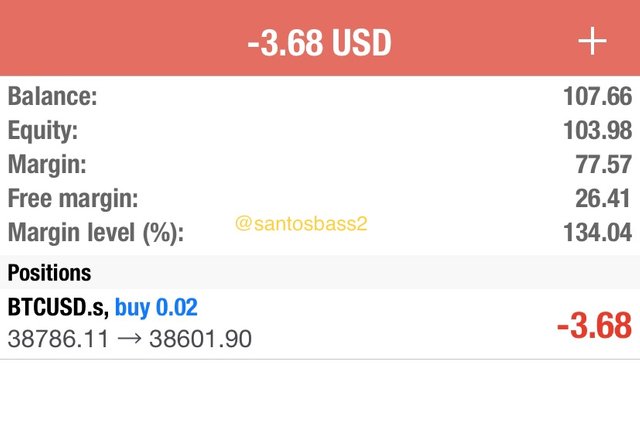
The trade exit is done with the appearance of a purple colour. As seen below, we have the appearance of a purple colour which I exit my trade with +$3 profits.
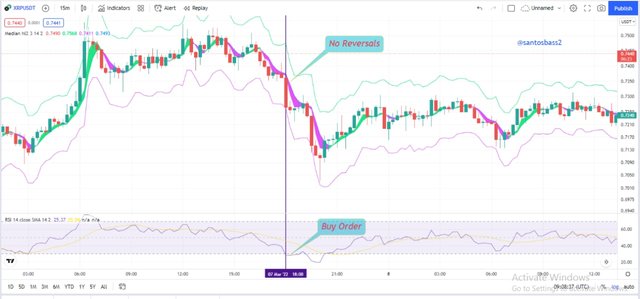
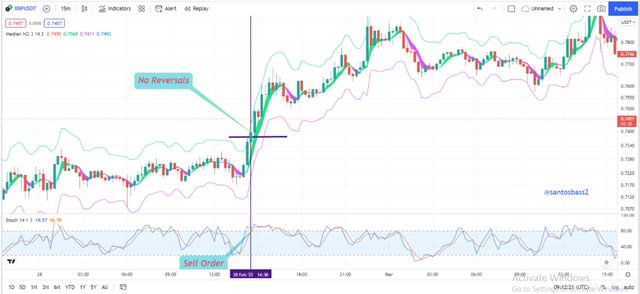
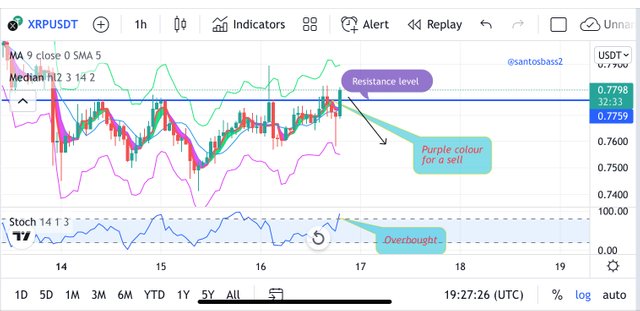
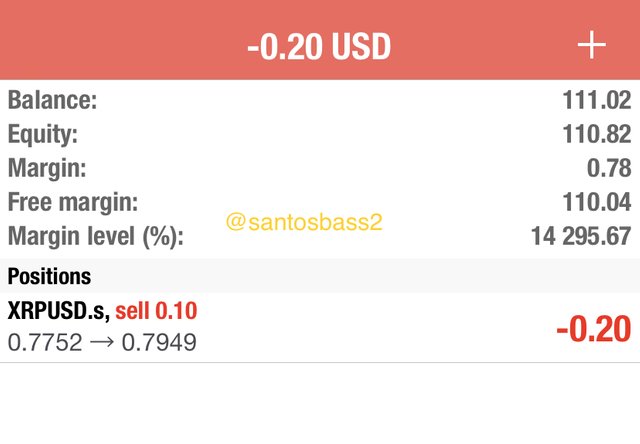
Using Median Indicator to Sell xrpusdt
The trade Entry will be done using the stochastic indicator and the median indicator. The stochastic indicator shows overbought and oversold areas for sell and buy Entry when we have the indicator above 80 and below 20 level respectively.
From the analysis below, we have the formation of an oversold by the stochastic and the appearance of a purple colour for a sell. I then enter the sell order and wait till the colour changes.
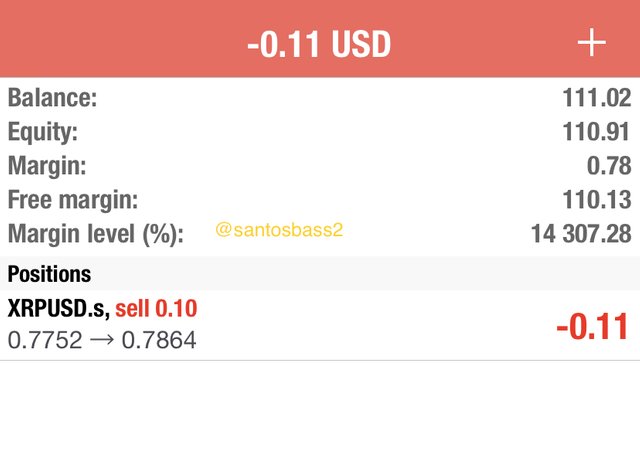
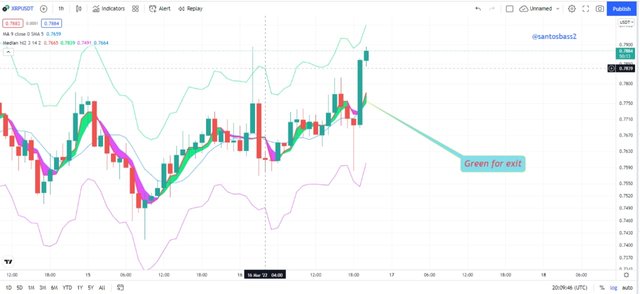
The exit is done using the median indicator as explained above. My exit is done at the appearance of a green cloud as seen, and I close my trade at -$0.2 as seen below.
Conclusion
From the analysis done so far, it indicates the median indicator is reliable as I have made a profit of 3.05 when I subtracted the loss from the profits.
In this regards we can use the median indicator alongside indicators such as stochastic, relative strength index and others to find the entry and exit points in the market.