[Fibonacci Tools] - Crypto Academy / S6W4 - Homework post for professor @pelon53


Explain in your own words what you mean by Fibonacci retracement. Show an example with screenshot.
Fibonacci Retracement
Before going to the background and general analysis of the Fibonacci retracement, the Fibonacci retracement is a type of technical analysis tool in which we use to find support and resistance levels.
Since it has been noticed that we have key levels in which the prices always respect in the market such as the support zones where the buyers are active and the resistance zones where the sellers are active, we see that it is quite important to use the the Fibonacci tool to find this support and resistance zones.
The Fibonacci came all about from the mathematical expression which happens to be a sequence of numbers. These numbers are naturally occurring numbers which are gotten from the adding of the previous two numbers. These include;
- 0, 1, 1, 2, 3, 5, 8, 13 …..
The fibonacci levels are then calculated from the these sequence. A level is added which is the 50% level. This level act as a level to balance up the market into equal levels and the levels are as seen below.
The Fibonacci has importance levels which include; 23.6%, 38.2%, 50%, 61.8%
In an uptrend, we normally plot the Fibonacci retracement tool from bottom to top. Before doing that, we need to begin making sure that we have an uptrend. After the identification we locate the swing high and the swing low levels. This level will be used to draw the Fibonacci as the tool will be drawn from bottom to top as seen below.

In a downtrend, we normally plot the Fibonacci retracement tool from top to bottom. Before doing that, we need to begin making sure that we have a downtrend. After the identification we locate the swing high and the swing low levels. This level will be used to draw the Fibonacci as the tool will be drawn from top to bottom as seen below.

Explain in your own words what you mean by Fibonacci extension. Show an example with screenshot.
The Fibonacci Extension Levels
Similarly to the Fibonacci retracement, the Fibonacci extensions identifies possible support and resistance levels in the prices of an asset. The Fibonacci locates the possible pull-back of prices as the prices makes a movement in an uptrend or a downtrend. We normally know that the movement of prices is either in an uptrend, a downtrend or in a range. In this regards, the Fibonacci extention is quite a suitable tool to use in the case of a trending market and not a ranging maket.
This is because, the market is known to move in a wave like manner having pull backs showing the relative demand and supply regions. Therefore, we can use the Fibonacci extention tool to find this levels.
Ther levels of the Fibonacci extention include; 1.271, 1.414, 1.618 etc. I will then explain below how to use the Fibonacci extension in an uptrend and a downtrend differently.
Just as in the case above in the Fibonacci extension, we are going to begin by locating the trend of the market. In this case, we are locating an uptrend.
We then locate the last swing low point of the price and the swing high and draw the projection to find the possible pull-back of the prices. The extension is drawn from the last swing low to the most recent swing high point. We can then see that from below.

Just as in the case above in the Fibonacci extension, we are going to begin by locating the trend of the market. In this case, we are locating a downtrend.
We then locate the last swing low point of the price and the swing high and draw the projection to find the possible pull-back of the prices. The Fibonacci extension is drawn from the last swing high to the most recent swing low. We can see that from below.

Perform the calculation of the Fibonacci retracement, for the levels of: 0.618 and 0.236. Pick a crypto pair of your choice. Show a screenshot and explain the calculation you made.
Performing Calculation of Fibonacci Retracement
Beginning by stating the mathematical calculation of the Fibonacci retracement, the formula is as this below;
- Fibonacci Retracement = X + (1 - %retrace / 100) * ( Y - X)
Where;
Y is the stop price of the retracement move.
X is the start price of the retracement move.
These levels include;
Retracement 1 = 23.6%
Retracement 2 = 38.2%
Retracement 3 = 50%
Retracement 4 = 61.8%
Retracement 5 = 78.6%
Using the formula as stated above we have;
- Fibonacci Retracement = X + (1 - %retrace / 100) * ( Y - X)

From the chart above, we have the following;
X = 2562.5
Y = 3036.2
Therefore;
R4 = 2561.5 + (1 – 0.23) x (3036.2 – 2562.5)
2561.5 + 0.77 x 473.7
= 2924
From the above chart, we see a correlation of the price 2924 with the 0.23 level.
Using the formula as stated above we have;
- Fibonacci Retracement = X + (1 - %retrace / 100) * ( Y - X)
From the chart above, we have the:
X = 0.120
Y = 0.128
Therefore;
R4 = 0.120 + (1 – 0.618) x (0.128 - 0.120)
0.12 + (0.382 x 0.008)
= 0.123

From the above chart, we see a correlation of the price 0.123 with the 0.618 level.
On a Live account, trade using the Fibonacci retracement, screenshots are required.
Selling hotusdt using Fibonacci Retracement
To begin, we need to identify the trend of the hotusdt which in this case is a downtrend as seen. After the identification, we continue by adding the Fibonacci Retracement tool to the chart.
This will be done locating the last swing swing high point and the most recent swing low point. We then draw the Fibonacci Retracement from the swing high to the swing low point.
Finding the entry point, we can see a Retracement at the 0.5 level as the prices make a bearish rejection at this level. We can see the analysis below.
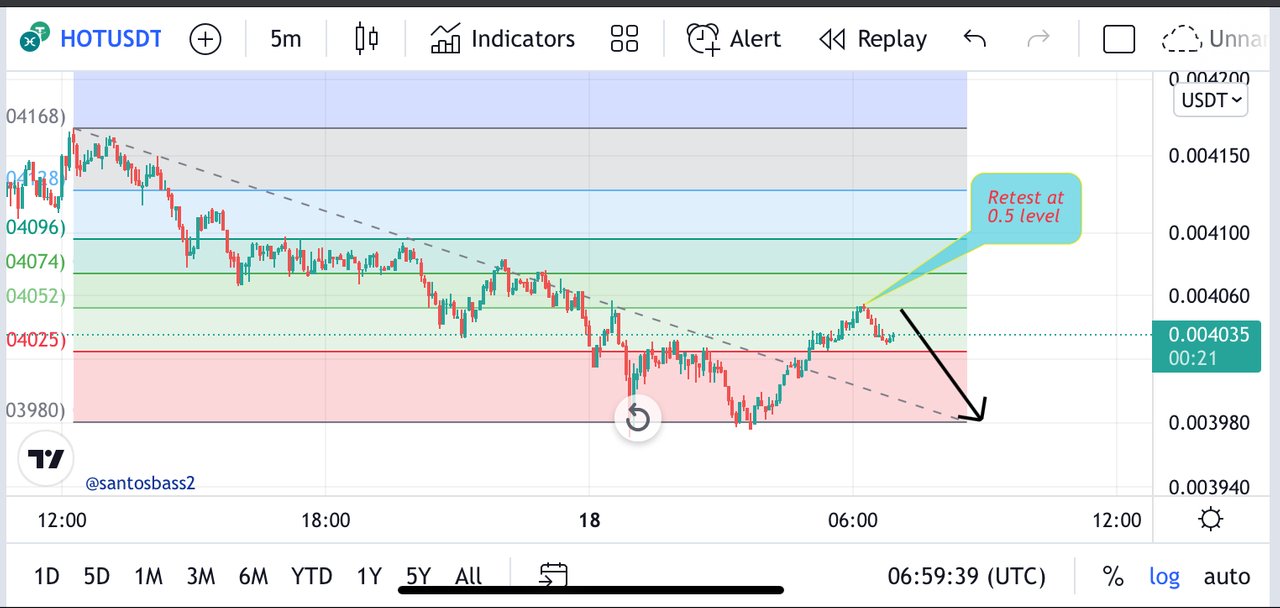
The stop loss is placed some few pips above the 0.5 level and take profit to a risk to reward ratio of 1:1.5 or below the 0.23 level as seen below.

The trade Entry is done with the #Binance Exchange using a leverage cross of 3X and initial margin of $3 as seen below.


On a Demo account, make a trade operation using the Fibonacci extension. Screenshots are required.
Selling the dashusdt using Fibonacci Extension
Just as above, we need to identify the trend of the hotusdt which in this case is a downtrend as seen. After the identification, we continue by adding the Fibonacci Extension tool to the chart.
This will be done locating the last swing swing high point and the most recent swing low point. We then draw the Fibonacci Extension from point 0-a-b as seen

Finding the entry point, we can see a Retracement at the 0.23 level as the prices make a bearish rejection at this level. We can see the analysis below.


Conclusion
The market is known to be made up of posions demand and supply zones which have the dominance of the buyers and the sellers respectively. This zones are known to have the high activities and injection of volumes which therefore form supply and resistance zones.
This levels can easily be found using the Fibonacci Retracement and the Fibonacci Extension which i have demonstrated practically with a live and a demo account.