[Psychology of Trend Cycles] - Crypto Academy / S6W4- Homework Post for @reminiscence01


explain your understanding of the dow jones theory, do you think dow jones theory is important in technical analysis?
The Dows Theory
The Dows theory which was discovered by the famous Charles Dow which he named the theory after him. The theory was discovered in the year 1897 which is way behind and has known to be quite successful. The dows theory explains how the market is formed generally. This means that dow’s theory explains the different market movement in the prices of an asset which is done based on accumulations, distributions, uptrend and downtrend and downtrend movements.
With this theory, we then see that it is quite very easy to analyse the market based on this movement using the technical analysis. The main idea behind the belief of the creation of this theory is that the market is believed to be greatly affected by economic news based on the demand and supply of that asset.
The main importance of the dows theory in technical analysis is for the fact that we can use the various phases in the formation of the prices which explains the psychology behind the movement of the prices in a great way. With this interpretation, we can therefore guess the next move of the prices with a greater probability.
in your own words, explain the psychology behind the accumulation and distribution phases of the market.
Psychology behind accumulation and distribution
The market has known to be follow three key patterns which are the uptrend formation, downtrend formation or a sideway formation. With this fornmations, when we combine then in total, we can have the market structure formation. This formation is what we can use to find key entry and exit points in the market. Therefore in this section, I will explaining the accumulation and the distribution which are also known to be sideway movements.
Explaining the accumulation phase, the accumulation is known to be the phase in which the whales are preparing to enter their positions. The accumulation is noted with a brief sideway movement which is notably to occur after a downtrend. This accumulation phase explains the activities of the whales as they will soon be a beginning of an uptrend.
Possibly, the breakout of an accumulaton phase is seen to be a perfect entry of a buy order by the bulls in the market when located right ahead of time. This is seen as we have a high injection of volume in the market by the whales or the big hands in the market.
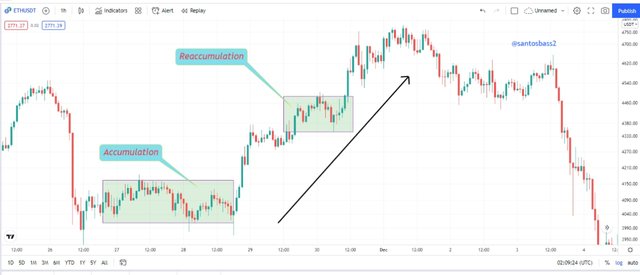
From the chart above, we see the formation an accumulation phase which is closely followed by an uptrend. The accumulation phase makes the preparation of the big investors in the market or better still the whales in the market. From the above formation we see a breakout which is the actual time in which the positions of the big investors is being entered. There is a little consolidation which could be mistaken for a reversal, but it is a point in which allows retail traders to enter their positions for a possible continuation of the trend.
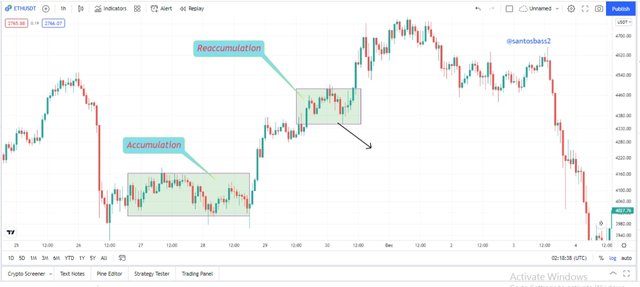
From the analyse above, we see that the only time we can assume for the point to be a reversal is if we have a breakout of the prices at the bottom of the reaccumulation channel.
The distribution phase is the exact opposite of the accumulation phase. The distribution phase is the plase in which we see the buyers preparing to exit their positions. The distribution phase is located at the near end of the uptrend. It marks a reversal of trend. In the distribution phase, we see the prices slowing down which we also have a decrease in volume.
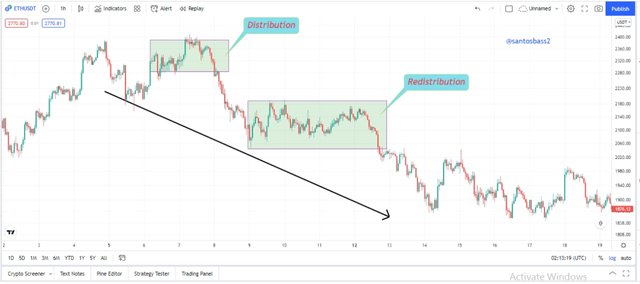
From the above formation, we see a see a distribution phase which is seen as big hands or strong hands are taking off their positions. In this regards, we see a panic in the retail traders as they see a slow movement in the prices. This is the best point to close buy positions and take sell orders. We see a redistributive phase which is a phase seen as the prices slow down to gain momentum to continue its downtrend.
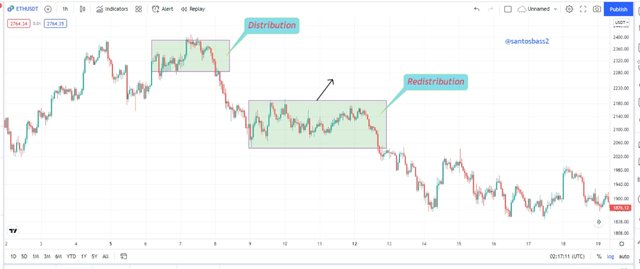
The redistribution phase is sometimes mistaken for a trend reversal as analysed in the screenshot above. As seen, the reversal is only valid if we have a breakout of the redistribution level in an upward level which is the resistance level.
explain the 3 phases of the market and how they can be identified on the chart.
Identifying the 3 phases of the market
We normally have 3 phases in the market, which are the uptrend, downtrend and a sideway movement. This means that the market will always move in one of the phase possibly in a wavelike manner which is principally controlled by the demand and supply in that particular asset or security.
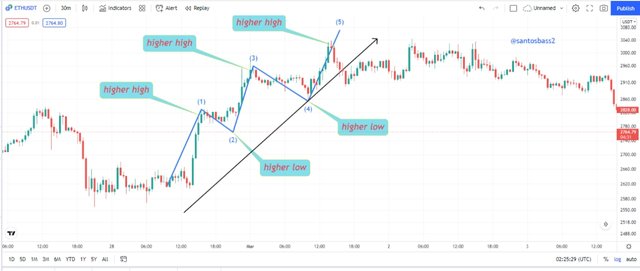
The uptrend which is seen to be controlled by the bulls in the market is seen to be a market formation where we have the formations of higher highs and higher lows swings. This explains a high demand for that particular security and a domination of buyers. We can see the structure below.
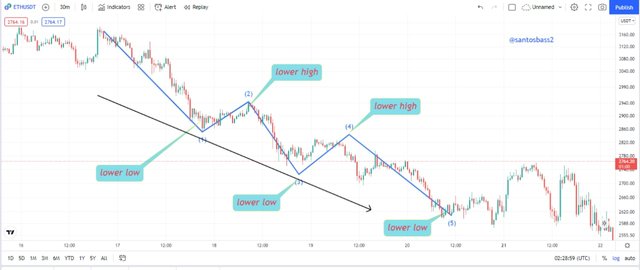
The downtrend is the exact opposite of the uptrend. The downtrend is seen when we have the formation of lower lows and lower highs as seen on the analysis below. Then downtrend is noted to be dominated by sellers in the market which shows a high supply of that asset. we can see that below.
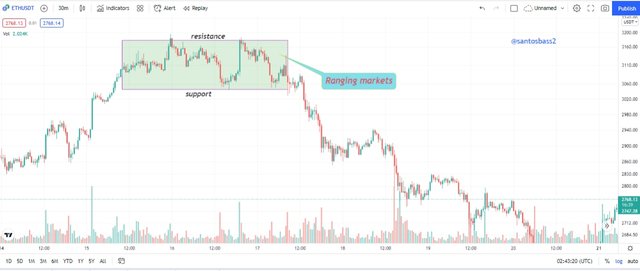
If the market is neither in a bullish trend or a bearish trend, then it is possibly in a sideway movement. This sideway is known to be consolidation periods as the market is neither control by the buyers or the sellers in the market. We can see that below.
explain the importance of the volume indicator. How does volume confirm a trend? Do this for the 3 phases of the market
Importance of Volumes in trend confirmation
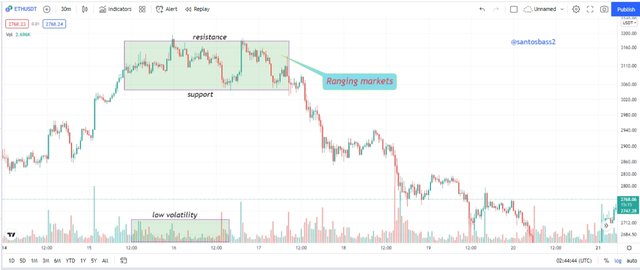
Volumes play key rule in the confirmation of trends in the market. This is seen through the different high and low volume formation in the various uptrend, accumulation, distribution and downtrend formation. This means that the volume indicator has a direct relationship with the market as it is being control by the forces of demand and supply.
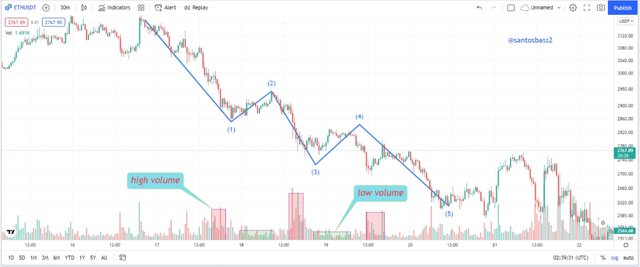
As seen on the analysis above, we have the formation of an accumulation at the beginning which is seen to portray low volatility. It is closely followed by an uptrend. The uptrend is seen by an increase in volume. We can see a high volume as highlighted on the chart. The next formation we have is the distribution phase. The distribution phase is seen with the formation of a sideway movement which has a low volatility. The last phase we have here is the downtrend. The downtrend is seen with a high selling pressure which is potrayed by a high volume.
From the analysis above formation, we now have a valid uptrend formation. The volume indicator can be used to find valid entry points when we have an increase in the volume. We can see a high volume when the prices make a high bullish move and a low retracement when we have a retracement. This means that the volume indicator is important in supporting the trend signals.
explain the trade criteria for the three phases of the market
Trade Criteria for the uptrend, downtrend and sideway phases
The three main phases we have in the market are the uptrend, the downtrend and the sideway movement as earlier explained above. Therefore each of this phases has its entry criteria which I will be explaining below.
For the bullish, we have the formation of higher highs and higher lows. We are therefore going to utilize this movements to find entry and exit positions using the following procedures below;
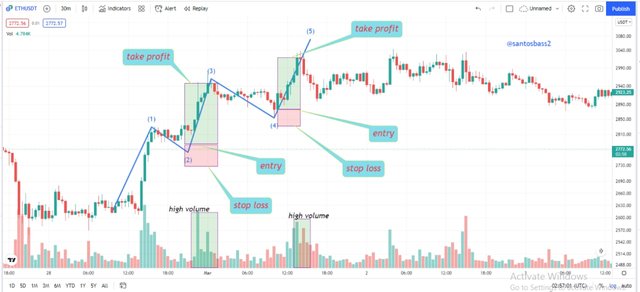
We begin by making sure we have a valid uptrend. This seen through the formation of higher highs and higher lows. And the next higher high must be higher than the previous higher high. Also, the next higher low must be higher than the previous higher low.
We can then use the volume indicator which will show an increase in volume in every valid up move.
We then need to patiently wait for the prices to make a retracement to the higher low point. We can then take a buy order at the next bullish candlestick pattern or any other type.
The stop loss will be placed below the swing low point. The take profit level will be set using the take profit level using a risk to reward ratio of possibly 1:1 or 1:2 risk to reward ratio.
For the bearish phase, we have the formation of lower lows and lower highs. We are therefore going to utilize these movements to find entry and exit positions using the following procedures below;
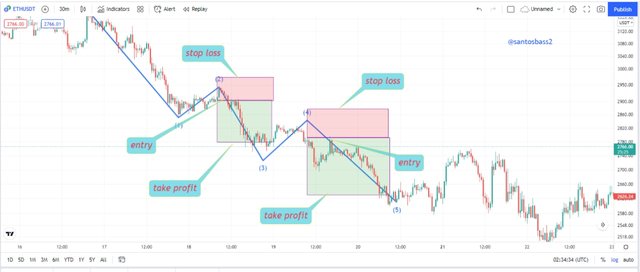
We begin by making sure we have a valid downtrend. This seen through the formation of lower lows and lower highs. And the next lower low must be lower than the previous lower low. Also, the next lower high must be lower than the previous lower high.
We can then use the volume indicator which will show an increase in volume in every valid down move.
We then need to patiently wait for the prices to make a retracement to the lower high point. We can then take a sell order at the next bearish candlestick pattern or any other type.
The stop loss will be placed above the swing high point. The take profit level will be set using the take profit level using a risk to reward ratio of possibly 1:1 or 1:2 risk to reward ratio.
The last phase I will explain now is the sideway phase. The sideway phase is seen when the market is neither trending up or down as earlier explained.
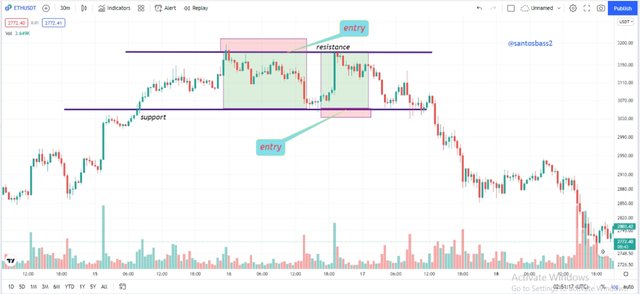
As seen on the analysis above, all we need to do in a sideway movement is to find the various support and resistance levels and draw this levels.
After drawing these levels, we take a valid buy order at the support levels as we have moer active buyers at this level and we take a sell order at the resistance level since we have more active sellers at these levels.
with the trade criteria discussed in the previous question, open a demo trade for both buy/sell positions.
Buying the BNBUSDT using the bullish market phase
For this entry, we begin by finding the trend of the asset which in this case has been seen we have a valid uptrend.
This seen through the formation of higher highs and higher lows. And the next higher high must be higher than the previous higher high. Also, the next higher low must be higher than the previous higher low.
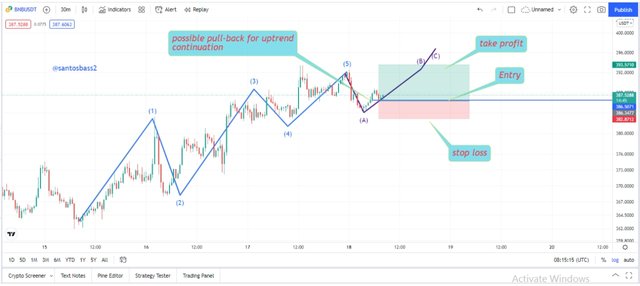
We then need to patiently wait for the prices to make a retracement to the higher low point. We can then take a buy order at the next bullish candlestick pattern or any other type.
The stop loss will be placed below the swing low point. The take profit level will be set using the take profit level using a risk to reward ratio of 1:2 risk to reward ratio.
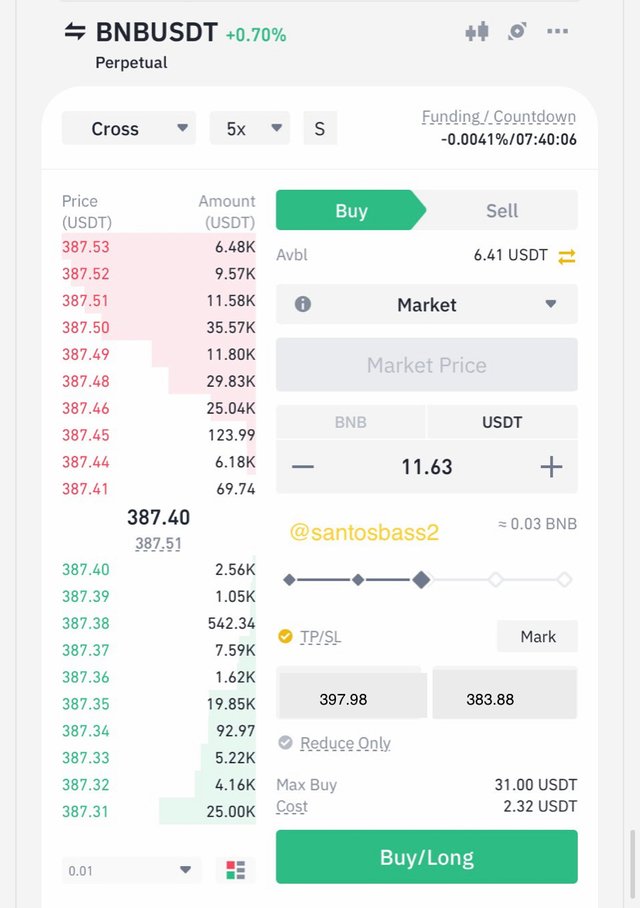
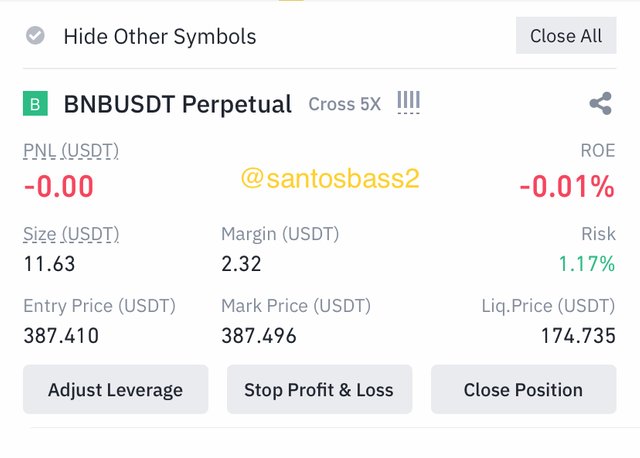
The trade Entry with the desired stop loss and Profit is as shown below.
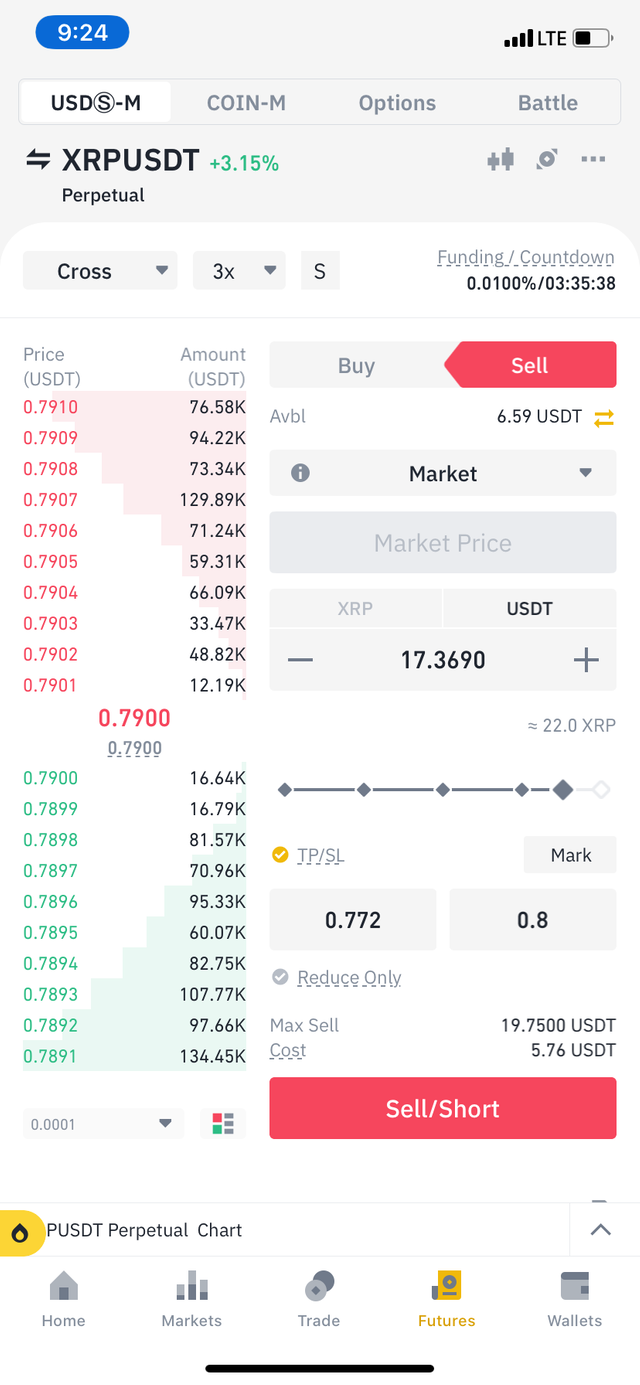
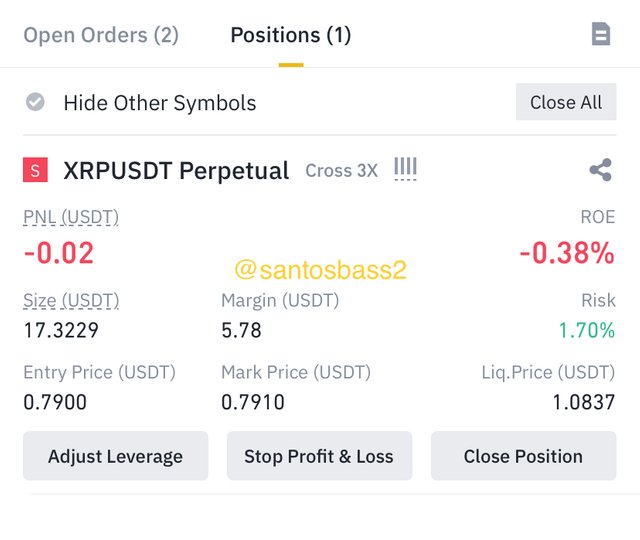
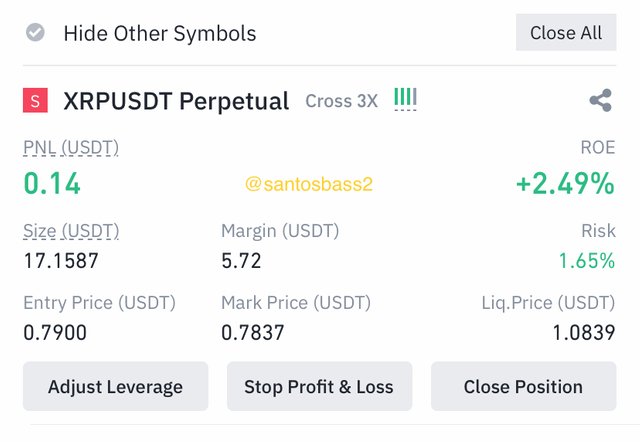
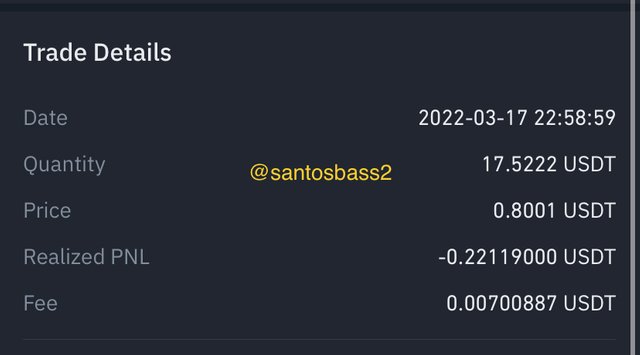
Selling the XRPUSDT using the sideway market phase
For the trade entry with the usage of the sideway markets, I will use the aspect of support and resistance as earlier explained above.
We begin by drawing out the support and resistance zones as shown below:
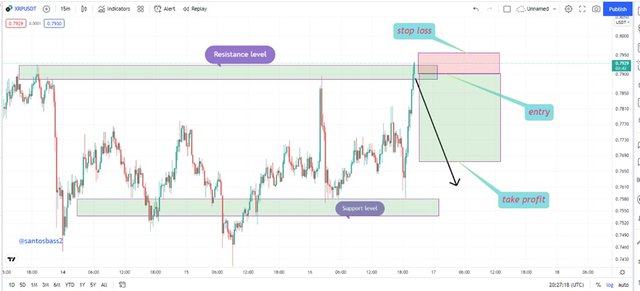
The trade will be executed at the touch of the resistance level showing a potential reversal. The stop loss is placed a few pips above the resistance level and take profit to 1:2 risk to reward ratio: or almost at the support level.
Conclusion
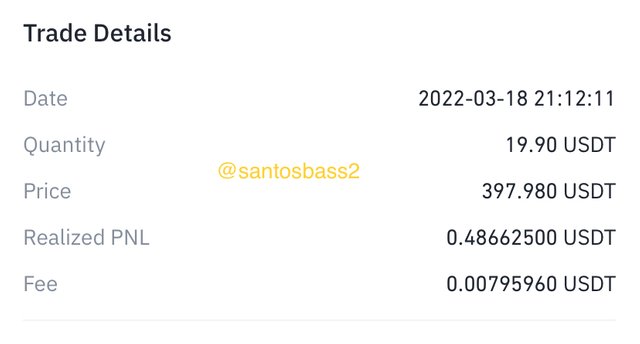
I have explained the different movement of prices in the market which include the bullish, the bearish and the sideway movements and demonstrated practically.
This is then evident enough on the advantage of this knowing these from the trades and the realized profits met up with.
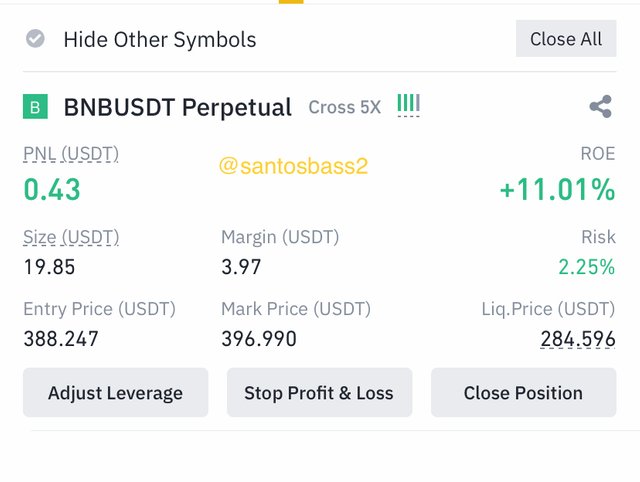
I made 1 loss and 1 profits which is -0.22 + 0.48 giving a profit in total.
CC: @reminiscence01
Hello @santosbass2 , I’m glad you participated in the 4th week Season 6 at the Steemit Crypto Academy. Your grades in this Homework task are as follows:
Observations:
This is totally wrong and was clearly explained in the lesson. You can just take a sell trade at a resistance level without any confirmation. Price is still bullish with green candles, it is not advisable to take a sell trade at this point.
Recommendation / Feedback:
Thank you for participating in this homework task.