Steemit Crypto Academy Season 03 |Homework task for @cryptokraze | Trading The Dynamic Support & Resistance
 Edited on Canva
Hello Everyone,
In the crypto academy season 03, week 4th professor @cryptokraze has explained details about Trading the Dynamic Support & Resistance
Which is quite clean and simple to understand and based on that I’m doing homework tasks for @cryptokraze.
1 - What do you understand about the Concept of Dynamic Support and Resistance? Give Chart Examples from Crypto Assets. (Clear Charts Needed).
For any trader, technical analysis is very important and decision-maker. And Dynamic Support and Resistance are the main factors. When non-horizontal support and resistance level make price chart in diagonal moving trends that support, and resistance called Dynamic resistance. This concept helps to make price strategy and price forecasting. It works based on the Exponential Moving Average concept which is formed using different lengths. Like 20 EMA longer distance away from 20 EMA that means strong bearish momentum. That helps traders to make proper decisions to take good trade. And it’s basically two condition
- Dynamic Support
- Dynamic Resistance
Dynamic Support :
When the market price move downtrend and touch the support, line move towards uptrends and price bounce back from EMA 50 line that creates the dynamic support. For example, let’s see the ETHUSDT price chart.

As we can see the price chart of 25th June 2021 touches the EMA 50 and moves towards uptrends. That bounce-back and creates Dynamic support.
Dynamic Resistance:
When the market price moves uptrend and touch the resistance line and move towards downtrend and price bounce back from EMA line that creates dynamic resistance. Let’s see the ETHUSDT price chart.
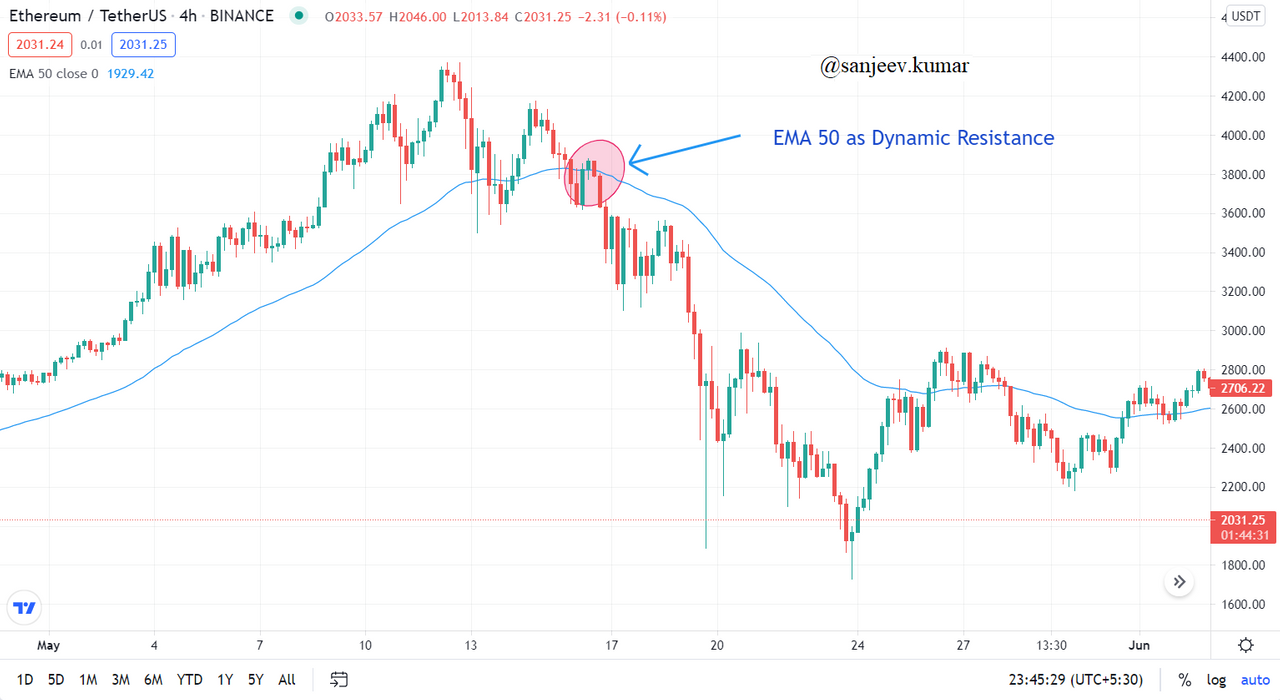
In the above screenshot, we can see the price chart of 16th May 2021 which touches the EMA 50 and moves towards downtrends. That bounces back and creates Dynamic resistance.

2 - Make a combination of Two different EMAs other than 50 and 100 and show them on Crypto charts as Support and Resistance. (Clear Charts Needed)
As we have already understood the dynamic support and resistance of 50 EMA now as the professor suggested other than 50 and 100 combinations so here, I have chosen 70 and 150 EMAs. Basically, it reduces the risk factor for doing trading. This helps to make the more accurate decision for trending.
For example, I chose the BNBTHB crypto pair. As in the below screenshot, we can see the 5th June 2021 1-hour chart that which support the 70 EMA and its occurred multiple time between 70 and 150 EMAs and bounce back. Which is strong support.
In the 2nd screenshot on 18th June the same time frame which resistance 150 EMA and occurred multiple times between 150 and 70 EMAs and bounce back. Which is exit trade.


3 - Explain Trade Entry and Exit Criteria for both Buy and Sell Positions using dynamic support and resistance on any Crypto Asset using any time frame of your choice (Clear Charts Needed)
There are four ways of trading from taking entry and exit points using Support and resistance.
Entry Trade
Entry Criteria for Buy Position
For Entering the trade, the EMA of length 50 and 100 will help us to make the right decision and these are the point that we need to keep in mind.
- First chose 50 and 100 EMAs from the indicator tool.
- The 2nd point is very important so take decision wisely, the price must be above 50 and 100 EMAs for buying trade.
- 3rd point is critical if the price touches the 50 EMA else cross 50 EMA so do not take immediate decision wait for a price bounce back and then buy trade.
- After the price bounces back if the price is above 50 EMA then you can place a buy order.

In the above screenshot, we can see the BNBTHB crypto on 30 April and 2nd May had touched the 50 EMA and bounce back which is the one-hour time frame.
Entry Criteria for Sell Position
For the sell also we are going to use the same EMA 50 and 100.
- First chose 50 and 100 EMAs from the indicator tool.
- The 2nd point is very important so take decision wisely, the price must be below 50 and 100 EMAs for selling trad.
- 3rd point is critical if price touches the 50 EMA else cross 50 EMA so do not take immediate decision wait for a price bounce back and then sell trad.
- After the price bounces back if the price is below 50 EMA then you can place a sell order.

In the above screenshot, we can see the BNBTHB crypto on 17th May touch the 50 EMA and bounce back which is the one-hour time frame.
Exit TRADE
Usually in the exit trade trader should set the stop loss and take profit.
Exit Criteria for Buy Position
I’m using the same 50 and 100 EMAs for Exit criteria for buy and these are the point that we need to keep in mind.
- First, we need to set our stop loss for buy in the price chart and the stop loss must be below 100 EMA.
- When the price limit touch or cross the stop loss. Then it’s not a recommendation for buy. Then wait for dynamic support in the next trade cycle.
- The main point is here to take profit from trade so fix the take profit level in the crypto chart. For buy trade, the take profit level should be above 100 EMA.
- When market prices touch or cross the take profit level. Then if perfect time makes profitable trade and exit from the market with taking a profit.
- Keep the stop loss and take profit ratio 1:1 (risk: reward) which means it should be equal to the stop loss level.

In the above screenshot, we can see the 22nd June ETHUSDT crypto chart. The candle bars are above 50 EMA and stop-loss level set above 100 EMA and kept ratio 1:1.
Exit Criteria for Sell Position
- First, we need to set our stop loss for sell in the price chart and the stop loss must be above 100 EMA.
- When the price limit touches or crosses the stop loss. Then it’s not a recommendation for sell. Then wait for dynamic resistance in the next trade cycle.
- The main point is here to take profit from trade so fix the take profit level in the crypto chart. For sell trade, the take profit level should be below 100 EMA.
- When market prices touch or cross the take profit level. Then if perfect time makes profitable trade and exit from the market with taking a profit.
- Keep the stop loss and take profit ratio 1:1 (risk: reward) which means it should be equal to the stop loss level.

In the above screenshot, we can see the 19th June ETHUSDT crypto chart. The candle bars are above 50 EMA and stop-loss level set above 100 EMA and kept ratio 1:1.
4 - Place 2 demo trades on crypto assets using Dynamic Support and Resistance strategy. You can use a lower timeframe for these demo trades (Clear Charts and Actual Trades Needed)
To perform this question I took 1st demo as BNBETH crypto pair.
Demo 1 : BNBETH
After waiting a long time I just select 15 minutes time frame

Order detail:


Buy price:0.14053
Stop loss: :0.14043
Take profit: :0.14155
Demo 2: DOGEUSD
5 minutes time fame

Order detail:


Buy price:0.1955
Stop loss: :0.19493
Take profit: :0.19755
Conclusion
Dynamic Support and resistance is really very good strategy to help traders, Which makes accurate decision-maker for technical analysis. In this task, I have understood that 50 and 100 EMA from professor lecture and I did my own research on 70 and 150 EMA and perform some real trading order. Once again thanks to professor @cryptokraze for this wonderful class.
Dear @sanjeev.kumar
Thank you for participating in Steemit Crypto Academy Season 03 and making efforts to complete the homework task. You got 8/10 Grade Points according to the following Scale;
Key Notes:
We appreciate your efforts in Crypto academy and look forward for your next homework tasks.
Regards
@cryptokraze
Thanks for your valuable feedback professor.