Steemit Crypto Academy Season 3-Week 7 [for @kouba01]|| Trading Crypto With Average Directional Index (ADX) Indicator||

QUESTION ONE
Average Directional Index(ADX)
ADX which stands for Average Directional Index is an indicator which is used by traders to determine whether there is a trend and also to ascertain the strength of that particular trend.This means the ADX does not only indicate a trade but points at the strength of the trend.
It is important to note that the ADX may not always work alone,it is best to accompany it to Directional Movement Indicator(DMI)inorder to get a better view of the trend and also to make informed decision.
The ADX is just a single line while the DMI has two lines which are the Positive Directional Indicator(DM+) and the Negative Directional Indicator (DM-).
It is important to note that the ADX line is used to measure the strength of a trend,while the DMI lines(DM+ and DM-) are used to know the direction of the trend depending on whether (DM+) crossed over (DM-) and vice versa.

But How Does ADX Measure the Strength of a Trend?
The ADX has a scale of 0 to 100.The value at any point in time shows whether there is a trend or not.Take a look at how to use the values of ADX to know the strength of a trend.
•ADX value from 0 - 25 means that there is no trend or a weak trend.
•ADX value from 25 - 50 shows that there is a trend.It indicates presence of a trend.
•ADX value from 50 - 75 show that there is a strong trend.
•ADX value from 75 - 100 shows that there is extremely strong trend although it rare to have such value.
Let's not get it twisted,ADX is not used to determine or detect a bear or a bull market.It is basically used to determine the strength of a trend according the value from a scale of 0 to 100.
Identifying ADX and DMI lines
Like i mentioned earlier,the ADX is just a single line while the DMI has two lines(one is DI+ while the other is DI-).In the chart below I used:
•Black line for ADX
•Blue line for DI+
•Red line for DI-
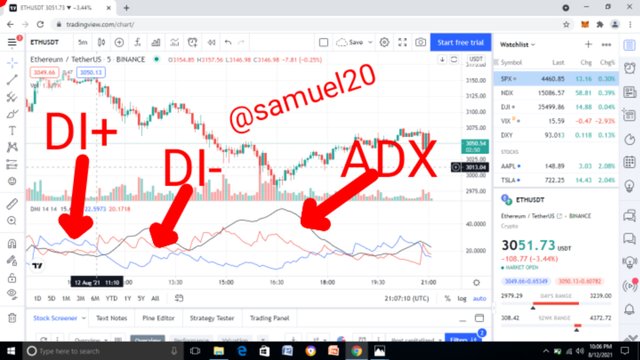
ETH/USDT chart tradingview.com
Crossing of DI+ and DI-
The crossing of the DMI lines is used to indicate the direction of a trend.If the DI+ line crosses the DI- line....it means that there would be an upward trend and if the DI- line crosses the DI+ line there would be a downward trend.
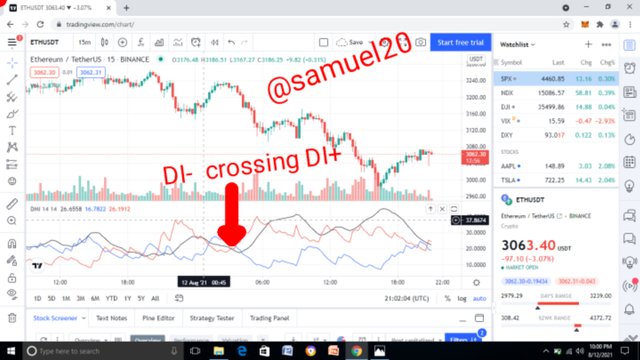 tradingview.com
In the chart above,notice that DI- line crosses over the DI+ line and so there was a downtrend.
However,this crossing could be decietful sometimes,there might still be cases where DI- would cross over DI+ and there won't be a downtrend and vice versa because this lines(DI+ and DI-)react so fast to the fast volatile prices of the market.

How to Calculate ADX
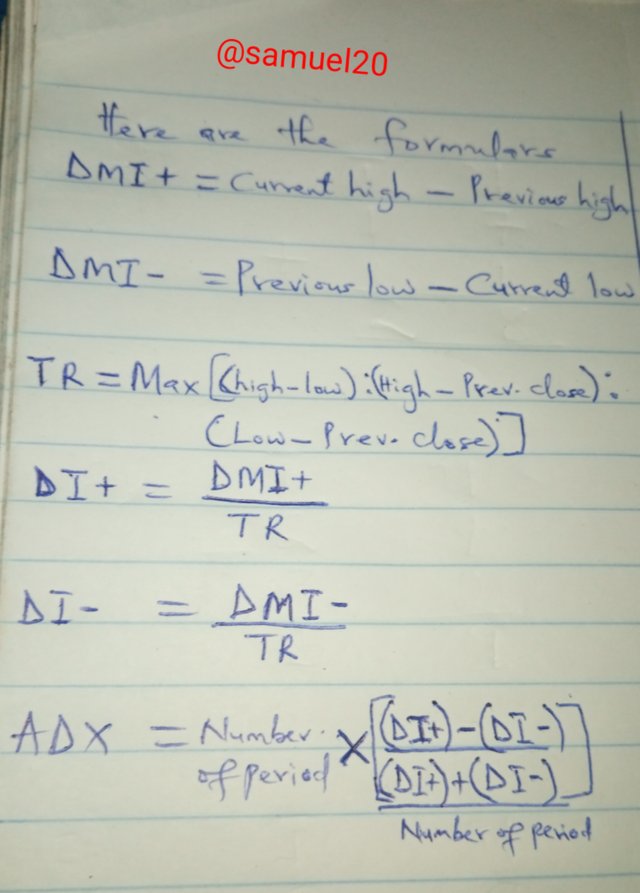
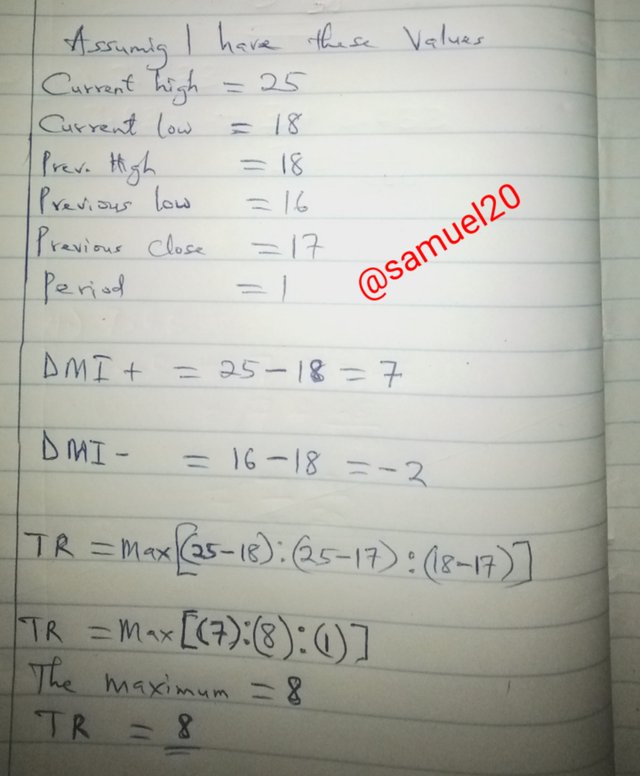
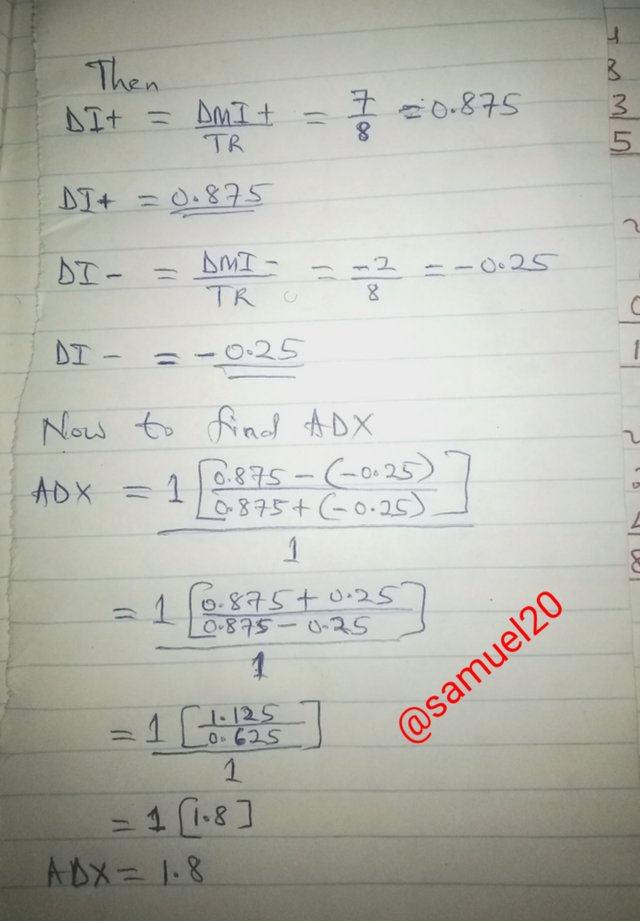
The value of ADX from the calculation gave me1.8 which means that there is no trend....I just formulated those values that I used for the calculation.They were not real values.

QUESTION TWO
Adding ADX line
I am using Trading view for my work.I add ADX using Trading view.Follow these instructions.
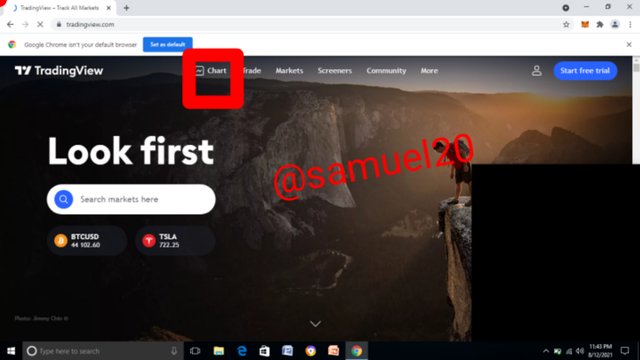
•Visit tradingview.com
•Click on 'Charts'
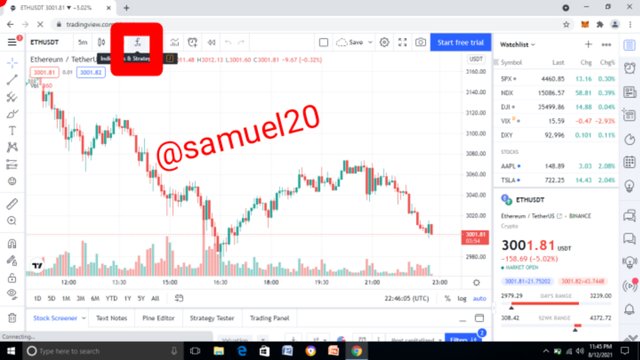
•Click on 'Indicators and Strategy'👇
•Enter 'DMI' in the search box and select it.
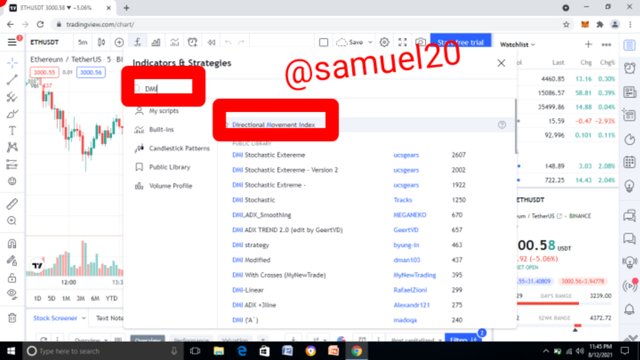
•This is the ADX line,DI+ line and DI- line
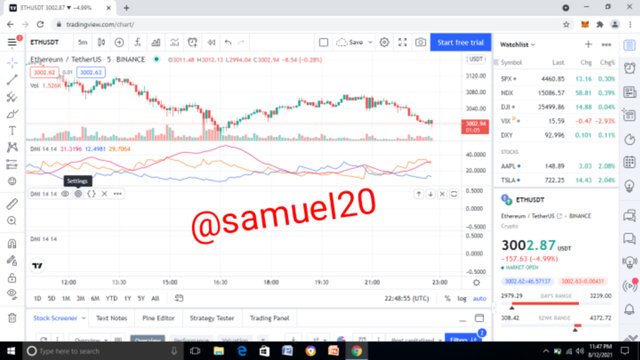

How to Set up DI+ and DI- lines
•Click on Settings on the ADX

•The DI has a default setting of 14,you can edit it to your desired length depending on what you want.
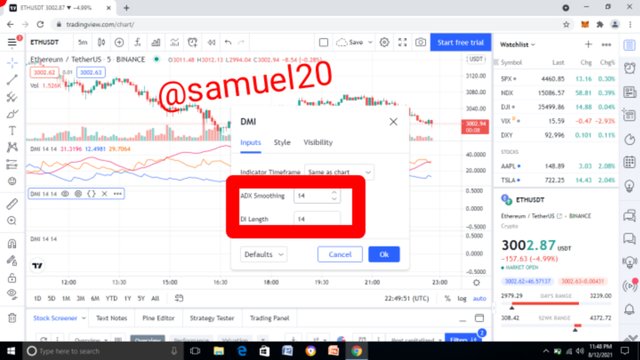
•You can also also edit the color of the ADX line,DI+ line and DI- line.
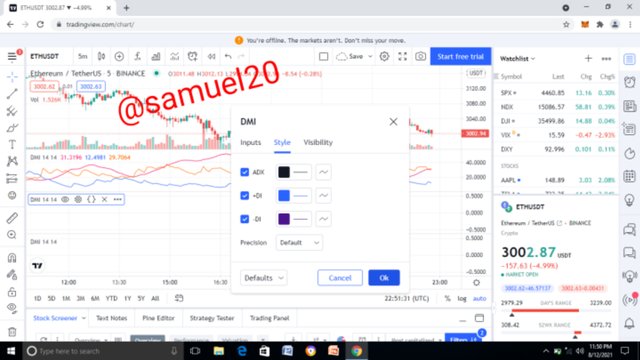
•Now the chart is ready.

Best Indicator Setting
The indicator Setting depends on the trader.We have long term traders and short term traders.
For short term trades,you can set the indicator to a length of 8 to say 25 with a short time frame.This means that it will be for maximum of 25 candles and would generate result very faster and saves time although it is risky because the market is highly volatile.
For long term trades,one can set the indicator to a length of say 30,40,60 depending on the preference of the trader.Longer indicator length will generate more reliable trend although it takes a longer time.
In summary,the best Indicator Setting is dependent on the mind of trader.Longer indicator length is more reliable because of the volatility of the market.

QUESTION THREE
Do you need DI+ and DI- Indicators to be able to trade with ADX
Well,the ADX itself is a line used to determine the strength of a trend.It is just a single line and can be used alone.For example of the ADX line is between 0 and 25,it means that there is no trend at all.When it is between 25 and 50, it means that there is a trend,At 50 to 75 means that there is strong trend while 75 to 100 shows strong trend.
However,using the other two lines which is the DI+ and DI- lines helps to know the direction of the trend.It is used to know whether the trend it is upward or downward.
I believe,it is important to add the DI+ and DI- lines so that a trader can read the market well(know the direction of the trend) so as to make good decisions.
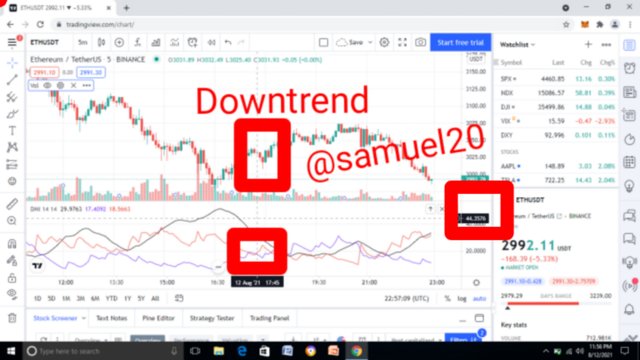
From the chart above,we can see that ADX(black line) is between 25 and 50(exactly at 44.35),which means that there is a trend but the direction of the trend was determined from the DI lines.The DI- line( red line)crosses the DI+ line(purple line) and it led to a downtrend.
**Advantages of the DI+ and DI- Indicator
•When used together with ADX gives a better view of the direction of the trend.
•They are used to filter wrong signals
•When combined with ADX helps a trader to know which direction the market is going.

QUESTION FOUR
Different Trend Detected Using ADX
The ADX is a single line that detects the strength of a trend.It can detect a no trend,presence of trend,strong trend and extremely strong trend.
•No Trend
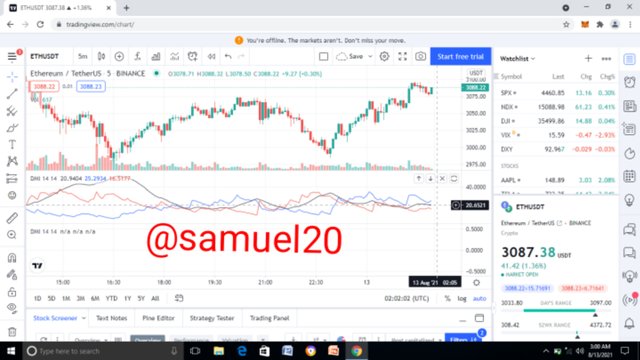
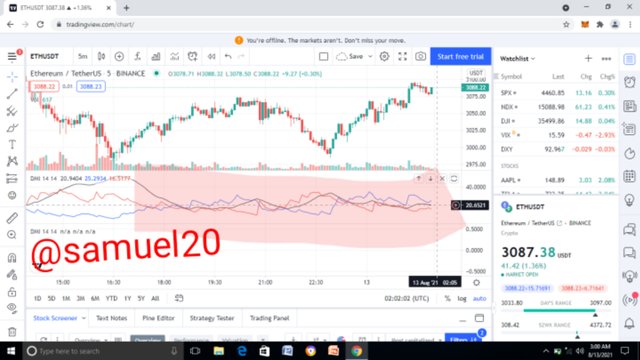
The ADX can detect when there is no trend in the market.At this point it means that both buyers and sellers are very effective.The market is moving sideways,we can call it the Accumulation Phase in the Whales Cycle.At this stage of No trend the ADX has a value between 0 and 25.From the picture above the ADX line is around 20 signifying No trend.
•Presence of Trend
This Isa period where there is presence of a trend although it is not very strong.It is worthy to note the ADX value of 25 is the bridge between between presence of trend and absence of trend.This trend at this point could be bearish or even bullish but not strong.Whenever the ADX value is between 25 to 50 it means that we have presence of a trend.
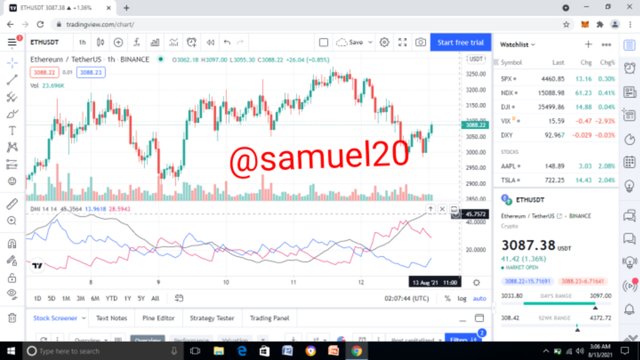
The picture above indicates that there is trend.Thid is because THE ADX line is between 25 to 50(at exactly 45.7.
•Strong Trend
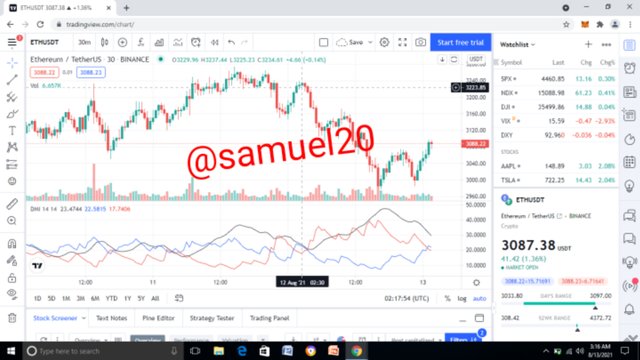
This is a period of a strong trend.The trend has be confirmed fully,and so the ADX value at this point is between 50 to 75.The trend could be a strong Uptrend or a strong downtrend.
•Extremely Strong Trend
This is the point where the trend at its peak.At this point the trend is too high although it is rare for such to happen.This extremely strong trend happens when the ADX value is between 75 to 100.
Filtering False Signals
Due to the high volatility of the market.Sometimes,a trade can make a wrong interpretation of the ADX.
With the right combination of the ADX and the DI lines,trader can filter out false signals.The Volatility of the market can lead to generation of false signals especially when using shorter indicator length and time frame.
When the ADX is moving above 50 and maintains its high up to 75 and above,it is a true signal.However,if it is going higher(high,) and then lower(low) within a short interval,it may be showing a downtrend even when the DI+ crosses the DI-...At this point there is a false signal.So the ADX direction and value together with the candle pattern would help to filter out the false signals by careful watching the value of the ADX abd the direction of the candle pattern with keen attention.

QUESTION FIVE
Breakout
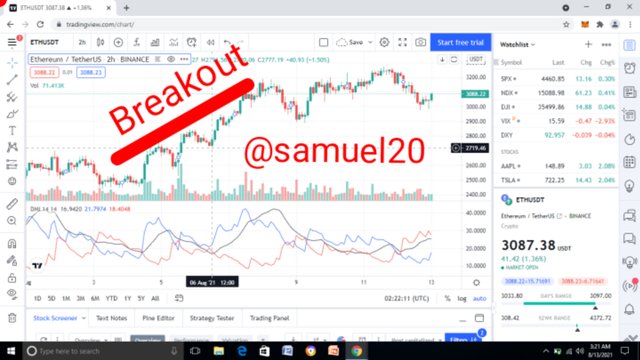
From the chart above;The price refused to go down after reaching Resistance: Signifying a breakout
In a trading chart,prices move up and down.There is point where the Uptrend cannot go beyond before going down,This point is called the Resistance.There is also a point where a Downtrend cannot move further below before rising again,this is called Support.
A breakout is simply a point where a price moved above the Resistance area or when the prices moved farther below the Support area.A breakout is a period of a continues trend.For example if we are having a Downtrend and a breakout occurs,it means that the Downtrend will trend stronger.If also we are having an Uptrend and a breakout occurs,it means that the Uptrend will continue.

How to use ADX filter to Determine a Valid Breakout
Sometimes there could be a decietful breakout.This would make a trader to make wrong decisions.However using ADX can help a trader to spot out invalid breakout.
For example if there is a breakout that occurs at the ADX value of 0 to 25,it is a false breakout and so the ADX could help to filter it out as a false breakout.On the other hand,if a breakout occurs and it is at an ADX value above 25 or 50 or higher,them it is a valid breakout
On the the hand,We also use the ADX to spot a false breakout.If the ADX value during the breakout is below 25,it means that there is a false or invalid breakout.The chart below shows a false breakout.
False signal,the ADX is very below 25

QUESTION SIX
ADX Indicator in Scalping Trading
Scalping involves a trader making decisions and completing his trades with a short period of time say 2 minutes,5 minutes,15 minutes.Tbus mode of trading will help to cut loss and also to take quick profit in a very short time frame.
The trader will have to set the ADX Indicator length at a very short and will also need to use other indicators and strategies so that he can deal with the fluctuations in prices which is caused by the high volatility of the market.Scalp trading may not generate more reliable trends.
ADX Indicator in Swing Trading
Swing Trading involves a longer time frame when compared to the scalp trading.In this type of trading,the trader chooses a longer time frame say 1 hour,4hours or more before he completes his trade.The method involves setting the ADX indicator length to a higher value with a higher time interval too inorder to generate more reliable trend.
Swing trading takes longer time but it helps the trader to monitor the market well.The process gives more time to filter wrong signals.
Which do I prefer
I prefer to use the ADX indicator for a Swing trade by Setting it to a higher Indicator length say50 or above and a longer time frame so that the ADX can generate all the trends fir me to make a better decision.
I prefer Swing Trading anyday and anytime.This is because it give me more time to spot false trends,generate clearer and reliable trends.It is obvious that the market is so volatile and so Swing trading helps me to make better choices.

Conclusion
ADX indicator is am important tool that is used to determine whether there is a trend in the market.It is also used to determine the strength of the existing combining ADX with the DI lines gives a perfect view of the market and so will help the trader to make good decisions.The ADX can still be used for both scalping and swing trading depending on the choice of the trader.
Thank you professor @kouba01 for the class.
All the charts used are from tradingview.com.
.jpeg)
Remember to review my work @kouba01
Hello @samuel20,
Thank you for participating in the 7th Week Crypto Course in its third season and for your efforts to complete the suggested tasks, you deserve an 8.5/10 rating, according to the following scale:
My review :
An article with good content in which you answered all the questions effectively and with a clear methodology, but certain points must be mentioned.
A simplified and understandable explanation of the indicator and its use.
The final operation is ADX = Sum of n [((DI +) - (DI-)) / ((DI +) + (DI-))] / n, So to get the correct ADX result, you need to calculate DX values for at least n periods then smooth the results.
Your explanation for changing the settings wasn't deep, just you gave the general idea without going into details.
A superficial explanation of two ways to trade with ADX indicator, as you confined to stating generalities without going into more details.
Thanks again for your effort, and we look forward to reading your next work.
Sincerely,@kouba01
Thanks @kouba01
I hope to score higher in your next homework.
This post is yet to be voted @steemcurator02
This post will expire in less than 20 hrs and it is yet to be voted @steemcurator01 @sapwood @steemcurator02