HEIKIN-ASHI TRADING STRATEGY- STEEMIT CRYPTOACADEMY/S4W2/ HOMEWORK POST FOR @REDDILEEP

Question One
Define Heikin-Ashi Technique in your own words.
Just as the name suggests,Heikin-ashi technique is a technique of making trading decisions using the signals sent by heikin ashi candlestick chart.
Heikin ashi is a candle chart pattern resembling the traditional candles. The difference which is easily observable by traders is the smoother appearance when compared. While traditional candles considers the low,high open and closing of an asset, heikin ashi considers the average of the previous candle and connect it to the present. This process explains the meaning behind its name. In Japan where the word heikin ashi originated, the word means average bar.
While most traders concentrate on other technical indicators to make trading decisions, newbies may fail to realise that the charts like the heikin ashi candles are equally an indicator and may provide good signals for trend, buy and sell entry and exit positions.
For instance, some of the signals provided by the heikin ashi candles includes spotting reversals using the doji candle. The doji appearing at the end of an downtrend indicates reversal to the bullish. On the other hand the doji appearing at the end of an uptrend signals Bearish reversal.
Aside from the reversals, heikin ashi can show trend, how strong the trend is and buy and sell opportunities.
Question Two
2- Make your own research and differentiate between the traditional candlestick chart and the Heikin-Ashi chart. (Screenshots required from both chart patterns)
Now let's see the difference between the Traditional Japanese candlesticks and the heikin ashi.
I have mentioned above that the heikin ashi resembles the traditional candlestick, this is true in the colours of candles in the traditional candlestick which is equally similar to the colours of candles in the heikin ashi.
One difference that is easily noticeable in the wigs of the candles, while the traditional candles may often have up and down wigs which shows high and lows anywhere within the chart, heikin ashi wigs are often one sided, indecision candles are few and Carry stronger message.
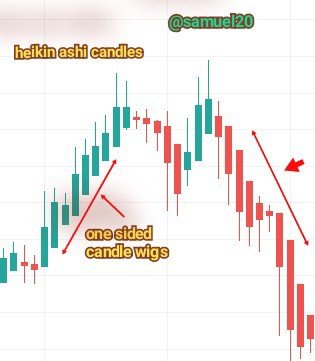
fig 1. Heikin ashi candles. Tradingview.com.
•••
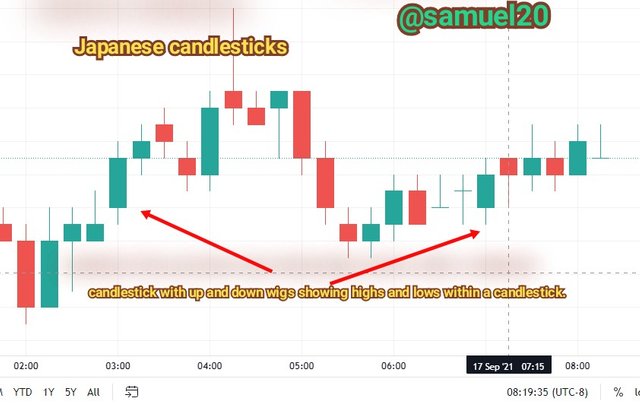
fig 2. Japanese candlesticks. Tradingview.com
•••
Another difference and why heikin ashi is preferred to traditional candles is that it is easier to dictate trend with it. In bullish movement for example, it is easier to point out the trend following the many successive green candles, such is replicated in the bearish trend as a user can see more red candles.
The reason for this difference is that little changes in price movements within a timeframe which represents individual candles are represented in the Japanese candlesticks whereas heikin ashi considers the more longer movement- an average of the price bar.
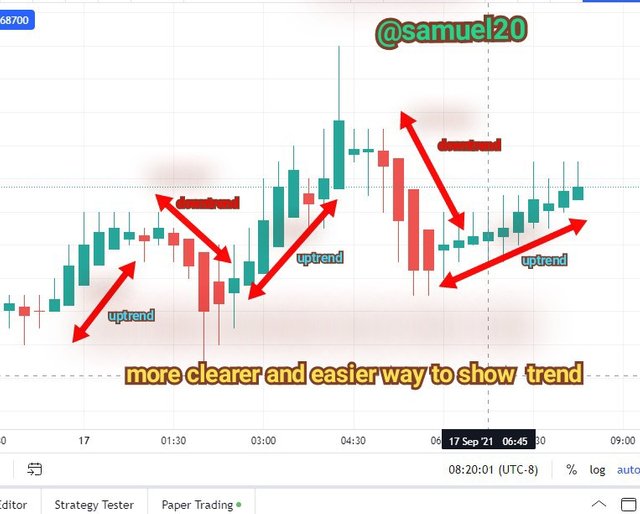
fig 3. Heikin ashi trend example. Tradingview.com.
•••
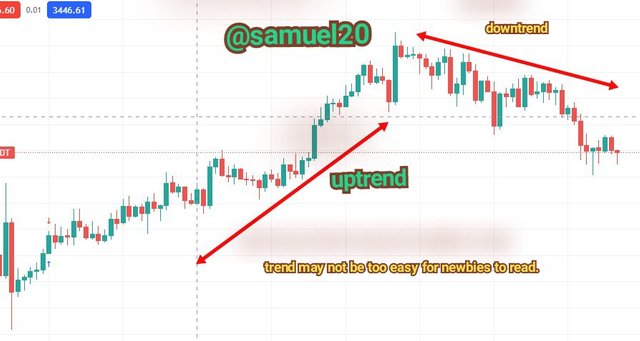
fig 4. Japanese candlesticks trend.Tradingview.com
•••
Referring to fig 3 and 4 above points out another difference. With heikin-ashi, it is easier to spot out reversals.
Another difference lies in the formula of getting the bar. Heikin ashi has a modified way of obtaining the candles.
Because of smoothing out noise, some important details are missed out in the heikin ashi, like gaps, traders who may prefer trading with these chart formations may need to use the traditional candlestick.
Advantages
- Easier to dictate trend, reversals and strength of the trend.
- It is smoother in appearance.
- It has fewer and stronger signals.
Disadvantages
- Some features present in Japanese candlesticks like gaps are missing.
- The price value do not reflect actual asset price.
Question Three
3- Explain the Heikin-Ashi Formula. (In addition to simply stating the formula, you should provide a clear explanation about the calculation)
As I noted above, heikin-ashi id different from traditional candlestick in the way that the candles are obtained. Both candles take into account open, closing, high and low of the previous periods but heikin-ashi obtains the candles in a modified manner by considering the price average of the previous closes.It deals with the average of the previous close.
Heikin-ashi formula.
HA open
Open = PO + PC/2 ( previous candle open + previous candle close divided by 2)
HA Close
CLose = CO + CL + CC + CH/4 ( current open + current low + current close + current high divided by 4)
HA high
High is the current maximum value of the current candle as compared with it's open, low and high.
HA Low
HA low is the current candle's lowest value as compared to the open, high and close.
HA = heikin-ashi.
Question Four
4- Graphically explain trends and buying opportunities through Heikin-Ashi Candles. (Screenshots required)
In this part, I will further point out buying and selling opportunities using heikin ashi.
How to determine buy signal.
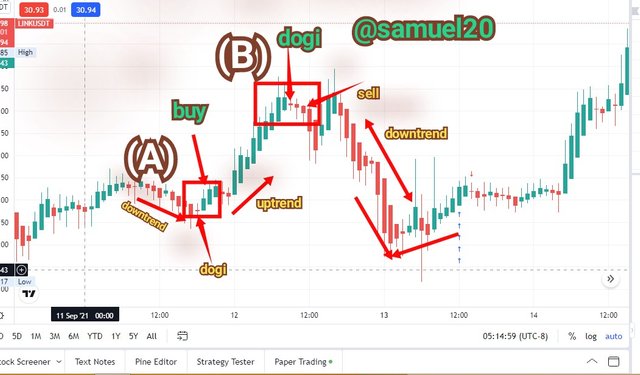
Fig 5.
To determine buy signal there must be an established downward movement and a clear reversal.
In the image above, we can see that playing out, At point labelled A,there was an established downtrend. Then a reversal is marked by the doji candle. I indicated Buy at the second candle after the doji. I did this to be certain that a reversal has actually occured.
Most times the dogi do not mark a complete reversal but a pause and then the trend continues.
Therefore to trade buy ensure that these criteria are met.
1° An established downtrend.
2° A reversal marked by the dogi.
3° allow for 2 or more green candles to ensure a reversal has occurred.
4° trade following the trend.
5° use risk to reward ratio to set stop loss and take profit.
How to determine sell signal
To trade sell, we follow similar example but in opposite direction. At point labelled B in the chart above, there was an established upward movement. The doji signifies a turn to bearish. I indicated sell at the second candle after the doji.
price retested resistance before continuing downward. This is why recommendations above may be necessary.
1° There should be an established uptrend.
2° A dogi should mark a reversal.
3° One should wait for two more red candles to be sure a reversal has occurred.
4° use risk to reward ratio to set take profit and stop loss.
5° Add trailing stop loss.
Heikin ashi is good in trading reversals, however following above criteria works well in determining entry and exit points.
Question Five
5- Is it possible to transact only with signals received using the Heikin-Ashi Technique? Explain the reasons for your answer.
Yes it is possible.The above example is an indication of such. Heikin ashi gives signals to traders that when mastered can lead a trader to profitability.
Traders has mastered chart formations like head and shoulders, sharkfins, pennant patterns, flags etc in collaboration with heikin ashi to become more profitable.
On its own heikin ashi is a complete indicator, it can help a trader make good entry and exit in trade.
Traders can combine other indicators to heikin-ashi for much Bette result and more credibility.
Question Six
6- By using a Demo account, perform both Buy and Sell orders using Heikin-Ashi+ 55 EMA+21 EMA.
In this exercise, I will add exponential moving averages to heikin-ashi chart, the period of 55 and 21.
There are various ways of using moving average strategies to trade. One way is to call out buy and sell signals through the moving average crosses. When a faster period moving averages crosses the slower from bottom to top, it is called a golden cross and a buy signal. When the faster period crosses the slower from top to bottom, it is called a death Cross and a sell signal is sent.
Another way to use the moving averages is to confirm trend. When the moving averages stays above the price chart, it confirms strong bearish trend, conversely when the moving averages stays below price chart, it shows strong bullish trend.
Using the later strategy, here are my preferred buy and sell entry options.
For buy signal
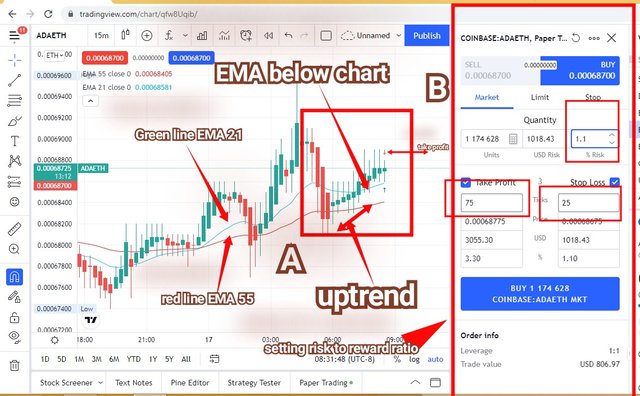
I enter the trade when the two ema has moved below the price chart.
Buy Trade. ADAETH [tradingview.com](
•••https://www.tradingview.com/)
Conditions for taking this trade.
- At point
A, I determined the trend. We are on an established uptrend after a bearish move. I waited for the two EMA to move below the price chart to confirm the trend. - I used settings side at point
Bto configure my stop loss, take profit, and profit ratio. - I entered the trade at the next candle after ema cross to below chart.
Sell trade
In this exercise, I used iqoption demo account. I used two screen shot to demonstrate my settings and the trade.
A
Image below shows my settings.
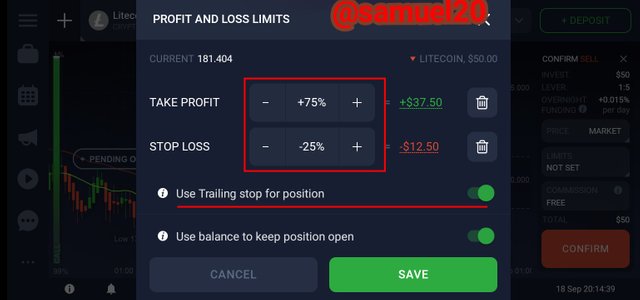
Take profit, stop loss and trailing stop loss settings. Iqoption.
•••
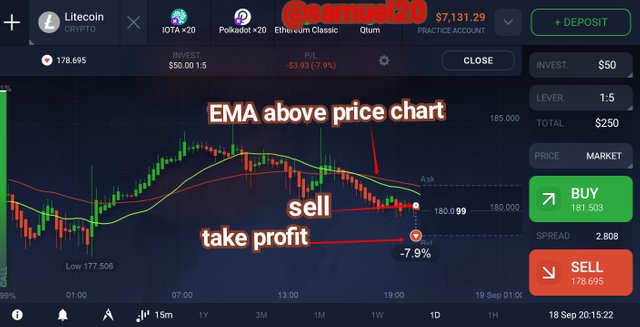
Litcoin. Sell trade. Iqoption.
- In the chart above I determined a bearish trend.
- I traded after a few rebound upward.
- I added trailing loss stop and and used 1:2 profit to reward ratio.
CONCLUSION.
The summary of the whole thing is that Heikin ashi on its own is a complete indicator. It is easier to determine trend when compared to traditional candlestick patterns.
Combining another indicator like MA or EMA for confirmation is also ideal because it helps for optimum results.Trading at a higher time frame is also good.
Thank you professor @reddileep for this opportunity.