CRYPTO ACADEMY:::::: HOMEWORK FOR BEGINNER'S CLASS BY @sammylinks
Hello everyone,
I'm very happy to participate in this week's lecture. I really appreciate your method of teaching, my crypto-professor @reminiscence01 and the rare opportunity offered by this academy.
This post is centered on the homework tasks given by our crypto-professor as stated below and the sections are the answers provided solely from my understanding of the course and researched work.
EXPLAIN THE JAPANESE CANDLESTICK CHART
DESCRIBE ANY OTHER TWO TYPES OF CHART
WHY IS THE JAPANESE CANDLESTICK CHART THE MOST PREFERRED CHART
DESCRIBE THE BULLISH CANDLESTICK AND THE BEARISH CANDLESTICK AND IDENTIFY ITS ANATOMY

EXPLAIN THE JAPANESE CANDLESTICK CHART
Cryptocurrencies Trading and Exchange focused mostly on the price movements. The price movements are very dynamic and volatile. It is very hard to know and failure to discern it's movements might spell doom or boom for a trader.
Technically, the price movements at any particular point of time is an economic functions of demands and supply parameters in the market. In the market trends, the demands and supply of that particular coin determine the rise and fall of the price of that coin in the market. The rise or open and the fall or close of the price of the coins constitutes the PRICES MOVEMENTS.
Since there's an empirical clues on how to detect the price movements although very dynamic but very helpful to the traders. Traders are keenly interested in exploring these clues through various means and Strategies. One of the Major means that have been useful to traders to study the market trends and prices prediction is the use of charts.
WHAT IS CHART
A Chart is a graphical representation of data. For this context, it is the use of symbols, lines, graph, images, pictures and patterns to represent the market value of the article of sale within timeframe.
There must be a systematic order at which those items are arranged and a time frame. That systematic order shows the movement of price and other market values should be properly represented in order to enhance the comprehension and understanding of the market.
In financial setting, a chart with the application of other Strategies is very important to detect price movements. The chart helps to compiled a lot of data concerning the market together with it's interaction and deviants over a period of time.There are different types of charts. Examples of the common ones for trades Includes:
- HISTOGRAM
- BAR CHART
- LINE CHART
- PIE CHART
- RENKO CHART
- CANDLESTICK CHART
Some are developed for specific purposes while there are common ones used for many reasons. Let's talk of the most popular one in cryptocurrencies Trading. Which is THE JAPANESE CANDLESTICK CHART.
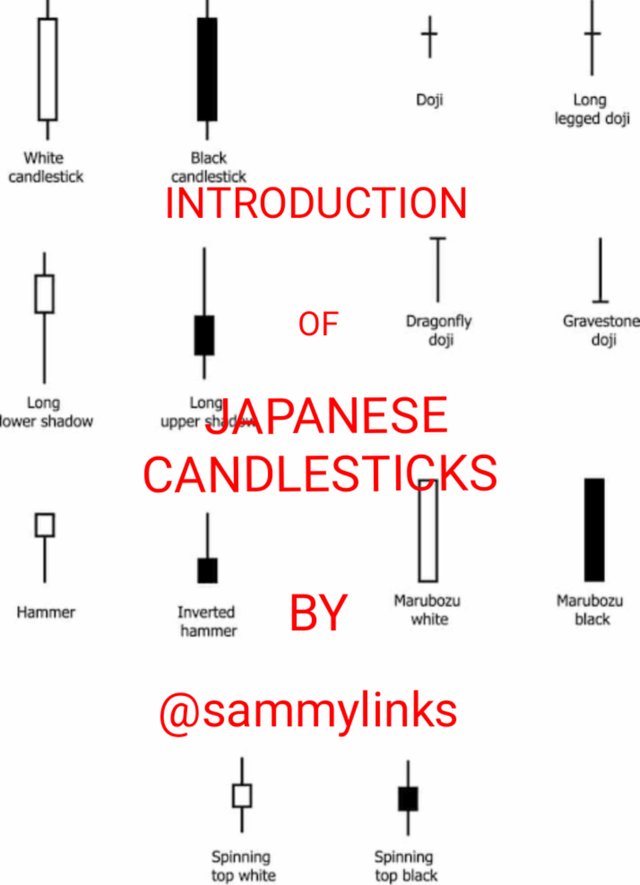
WHAT'S THE JAPANESE CANDLESTICK CHART
Candlestick chart are developed in Japan by a rice seller called Munehisa Homma. But it was popular known as a Japanese candlestick chart. This chart have been very effective. Although having been developed before other types of charts like bar charts.
He developed this useful tool of trade for his rice enterprises. As it's very helpful to ascertain the quantities demanded and supplied at any point in time. It should the price movements as a result of the intersection of the demand and supply of the commodities in trade. It also indicated that the trade psychology of those customers as it influences the dynamic nature of the price.
The uniqueness of the Japanese candlestick is not limited to the empowerment of the traders to predict the price because it is actually arranged accordingly to the price movements over the time but it also indicated the emotional state of those trader and it show this by it's distinct colors.
THE COMPONENTS OF THE CANDLESTICK
A typical candlestick have four distinct parts with it's real body. These four parts represent the major behaviors of the buyers and sellers and the initial Market value (i.e, open price) and the final market value (i.e, close price) at the particular point of time.
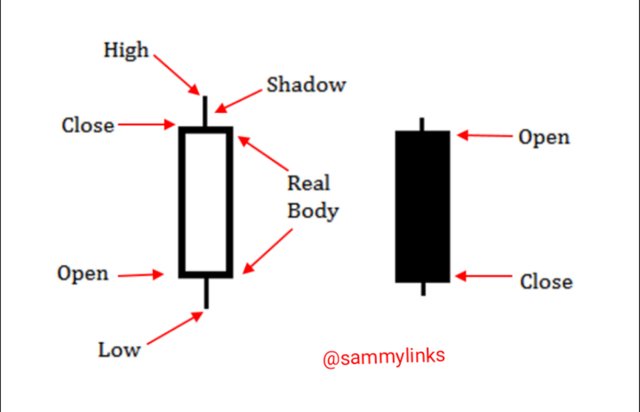
However, these four major part of the Japanese candlestick include. OPEN, HIGH, CLOSE, LOW. At the picture above shows, these four major parts represent an important factor in the market.
INTERPRETATION OF THE COMPONENTS OF THE CANDLESTICK.
These are the indices which these four major parts of candlestick represented and their useful roles includes:
OPEN
As the name implies, it is the opening price or the initial market value of the commodity at specified point of time in the trade. The initial bidding of the buyers at that time.HIGH
It is found at the tip of the shadow at attached to the real body of the candlestick. It shows the highest price of the commodity ( i.e, digital coins specified since we are discussing this context as relate with world of cryptocurrencies).CLOSE
This is the closing price or the final market value of the commodity on the trade. The final asking price from the sellers in the market.LOW
This is the lowest price of the commodity. It is found at the bottom of the shadow at attached to the real body of the candlestick.
OTHER MINOR PARTS OF THE CANDLESTICK AND THEIR SIGNIFICANCE.
SHADOW
Another name can be "wick". This is a tip from the real body of the candlestick. It always indicate the distance between the high and low of the price of the commodity at a point in time. It can varies between being long or short. It can be used to discern the overview of the market trend(i.e, the struggle of the buyers and sellers) at the point in time because it shows the drastic relationship between the open, close, high and low of the market value at that specified time.REAL BODY.
It show the continuous relationship(i.e, distance apart) between the openning price and closing price of the commodity at that point in time. This continuous relationship can be long or short indicated by the length of the real body of the candlestick.
Although the color and other things are on the discretion of the trader to choose based on how he/she wants as regarded to the market. But whenever the real is black, it means that the close was lower than the open while otherwise means opposite.
DESCRIBE ANY OTHER TWO TYPES OF CHART
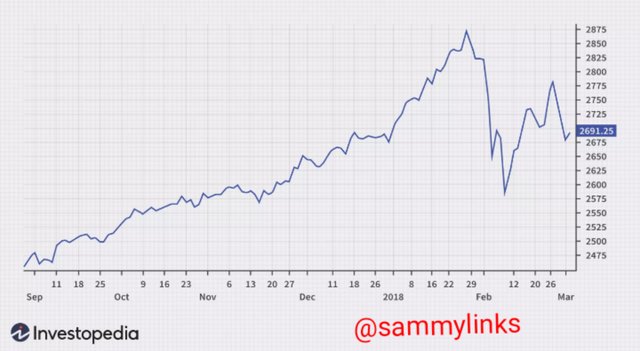
- LINE CHART.
The first known line charts are usually credited to Francis Hauksbee, Nicolaus Samuel Cruquius, Johann Heinrich Lambert and William Playfair. Source.
This is the type of chart where a line as a graphical tool are used technically to connect the specified point or price change over the period of the trade. This type of chart indicate the price movements along the timeframe of the trade. Those specified point indicates the intersections of the prevailing factors of demands and supply of the commodity at that point in time. As the price changes over the time or remains steady which is very rare along the timeframe. The line used will continue progressively.
UNIQUENESS OF LINE CHART.
Line charts are very easy to understand and mostly show to the daily prices range of the market. Customers can make good financial decisions instantly on line charts because of not using ambiguous facts.
Technically, the support, resistance and stop loss level are usually in form of lines. Making it very useful for traders to monitor their trade to minimize losses and maximize profits.
But the demerits of line charts are numerous too like not having enough facts to discern the market trends comprehensively and can't be supported by other technical skills and Strategies to study the market critically to maximize profits.
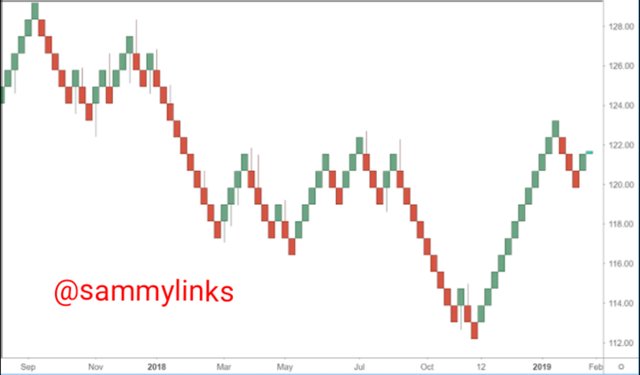
RENKO CHART
Another chart developed in Japan. It involves the use of "renga"(i.e, the Japanese word for brick) to represent the price movements. A new brick introduce immediately the prices fluctuates and it's placed near the previous bricks at the 45 degrees based on the direction(i.e, up or down) of the price.
There are two sets of bricks. They are:
UPWARD BRICKS:
These upwards bricks are used to indicate the price rise and they are colored white.DOWNWARD BRICKS.
they are bricks placed 45 degrees downward from the immediate previous bricks. They indicate the decline of the price. They are either colored black or red.
UNIQUENESS OF RENKO CHART
This chart is specially designed to focus on other market trends apart from the timely relationship of market values.
With this chart, a trader can discern the volatility nature of the market and trade accordingly.
The able of use of closing price for the introduction of the bricks are very helpful and to pinpoint the actual price movements.
DESCRIBE THE BULLISH CANDLESTICK AND THE BEARISH CANDLESTICK AND IDENTIFY ITS ANATOMY
As fore mentioned, Candlestick chart indicate the trade psychological state of the traders. The major emotional aspects of the traders on the Candlestick are symbolised by the use of colors on them. There are two basic candlesticks found on the charts. They are:
- BULLISH CANDLESTICK
This is the kind of candlestick used to represent the price increase. Typically, the upward candlestick showing the the increasing price change over the time.
- CHARACTERISTICS OF BULLISH CANDLESTICK
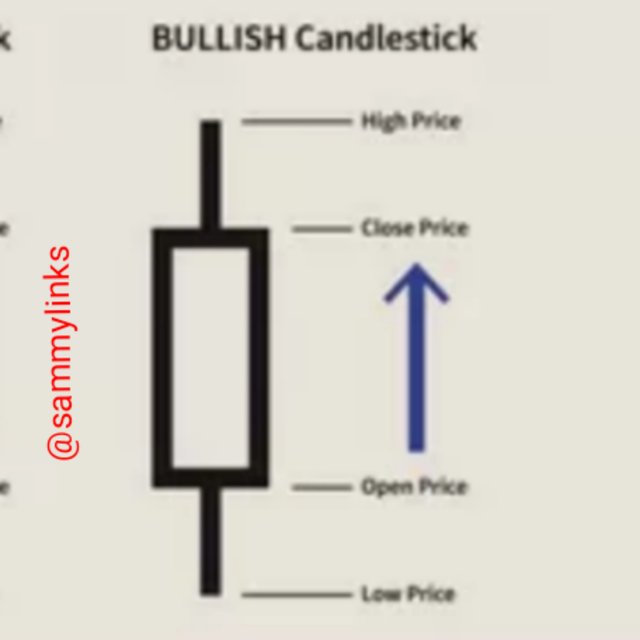
As the picture above indicated, The arrow shows that there's increase in the price as it pointed upwardly from the opening price to the closing price of the Candlestick.
The continuous usage of the bullish candlesticks on a chart shows the increasing and upward movements of the price which is characterised by the constant buying activities of the buyers with limited supply. This action leads to price soar. It is called UPTREND PERIOD OR BULLISH TREND.
- BEARISH CANDLESTICK
This kind of candlestick shows the decline of price. The use of bearish candlestick indicate the downward movements of the price of the commodity.
- CHARACTERISTICS OF BEARISH CANDLESTICK
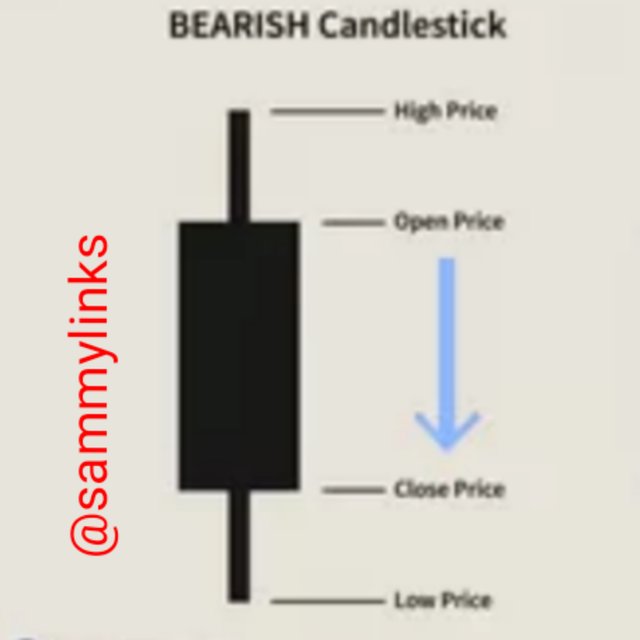
In the picture above, the arrow pointed downwardly indicating the decline of the price change from the opening price to the closing price of the commodity.
The continuous usage of the bearish candlestick indicate a bearish situation or trend in that there's a clear indication of price falls. Here, the price is low because of many of the commodity supplied by the sellers are higher than the demands of the buyers.
MAJOR DIFFERENCE BETWEEN BULLISH AND BEARISH CANDLESTICKS
There are many Difference between #bullish and the #bearish Candlestick but the major ways will be show in the table below.
| BULLISH CANDLESTICK | BEARISH CANDLESTICK |
|---|---|
| It indicates price increase | it indicates price decrease |
| Repeated usage on the chart shows bullish situation | Repeated usage on the chart shows bearish situation |
| Buying orders | selling orders |
| The arrow pointed upward | the arrow facing downward |
CONCLUSION
Technical analysis is one of the best method of discerning the price movements and the market trends of any trade. Ability to forecast the price helps to maximize profits and minimize losses of assets. This Technical analysis centered on the intersections of the demands and supply chains management and consideration of the emotional state of the traders. Technical analysis are mostly done with the help of charts.
Candlestick chart and others special designed charts helps to know the price movements and to study the volatile nature of the market.
Hello @sammylinks, I’m glad you participated in the 2nd week of the Beginner’s class at the Steemit Crypto Academy. Your grades in this task are as follows:
Observations:

Please use your own chart to illustrate this.
You did not answer the 3rd question.
Recommendation / Feedback:
You did a great job but you didn't complete the assignment. This will affect your grades.
Thanks Prof. I will apply all the suggestion
Please this post is now 6 days old @reminiscence01 and @steemcurator02
Thanks so much