CRYPTO ACADEMY WEEK 12/ HOMEWORK FOR @kouba01 :: Relative market strength:: by @sammylinks
Hello everyone,
I'm very grateful for the lecture given by our crypto-professor @kouba01 which formally initialed me into practical crypto currencies trading with relative market strength indicators for efficient trading with reduced loss but high profits.

RELATIVE MARKET STRENGTH
.jpeg)
This is a trading approach that helps to determine the market value of crypto currencies which in turn create a wonderful opportunity for momentum investment.
However, with relative market strength, skillful analyst can identify the performance of every crypto currencies in terms of their prices in the market within a range of time. Relative market strength aid the analyst to know the overbought and oversold signals, entry and exit points etc.
The very essence of the relative market strength is that a trader will buy high and sell even higher so as to maximize more profits with serious check on loss of resources since it's tied with the current market trends and benchmark. With the relative market strength, the performance of the pairs of crypto currencies will be evaluated and help traders to invest wisely and utilize the returns.
Can Relative market strength be trusted with crypto currencies trading? Why?
- Yes
The uncertainty and unreliability of crypto-currencies market often occurs due to the fluctuations of prices as the market forces of demands and supply. The profits and lost of resources for such trading is always the concern of a trader as he/she always check the market trends to know how best to manage his/her assets. But with Relative market strength, which is very important and very helpful to manage the market trends and market forces. An investor will become better in their investment portfolios.
How can you configure the relative market strength indicators on the chart and what does the length parameters means? Why is it equal to 14 by default? Can we change it?
This special market indicator, RSI can be configured on the chart to help a trader. To achieve this:
- 1
Click on the chart and select the pair to trade on
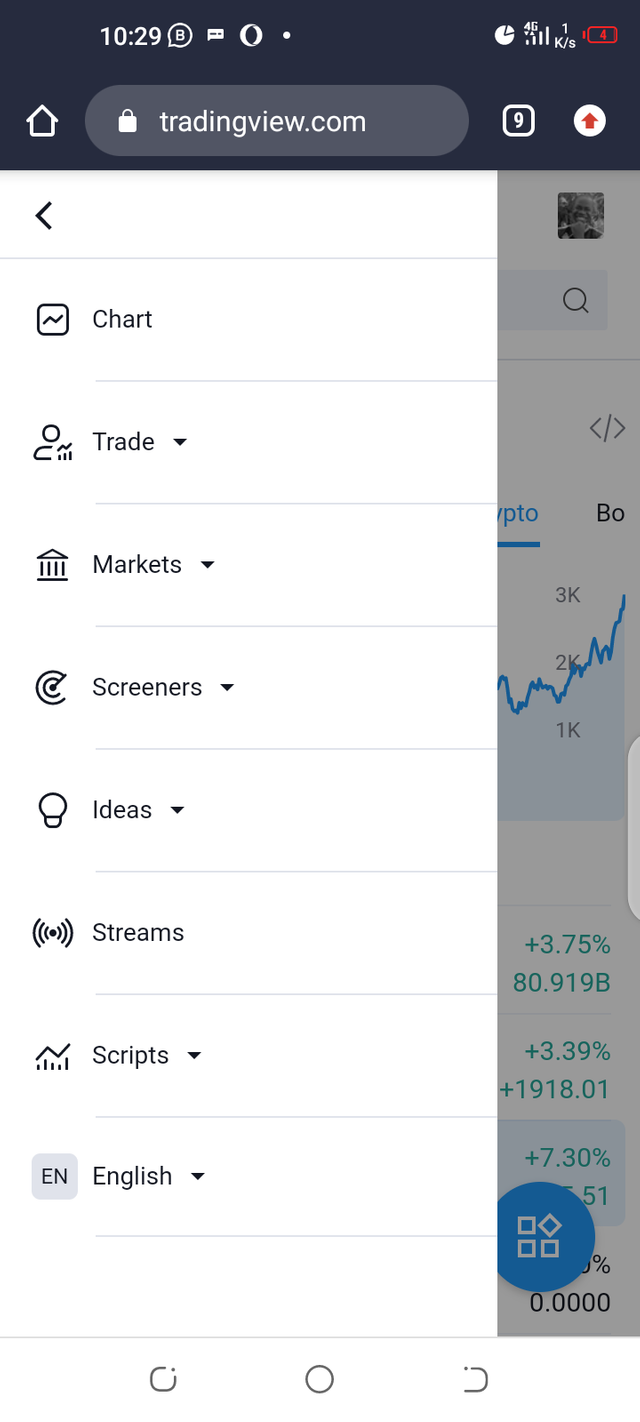
- 2
Check on Fx indicator button on the bar above
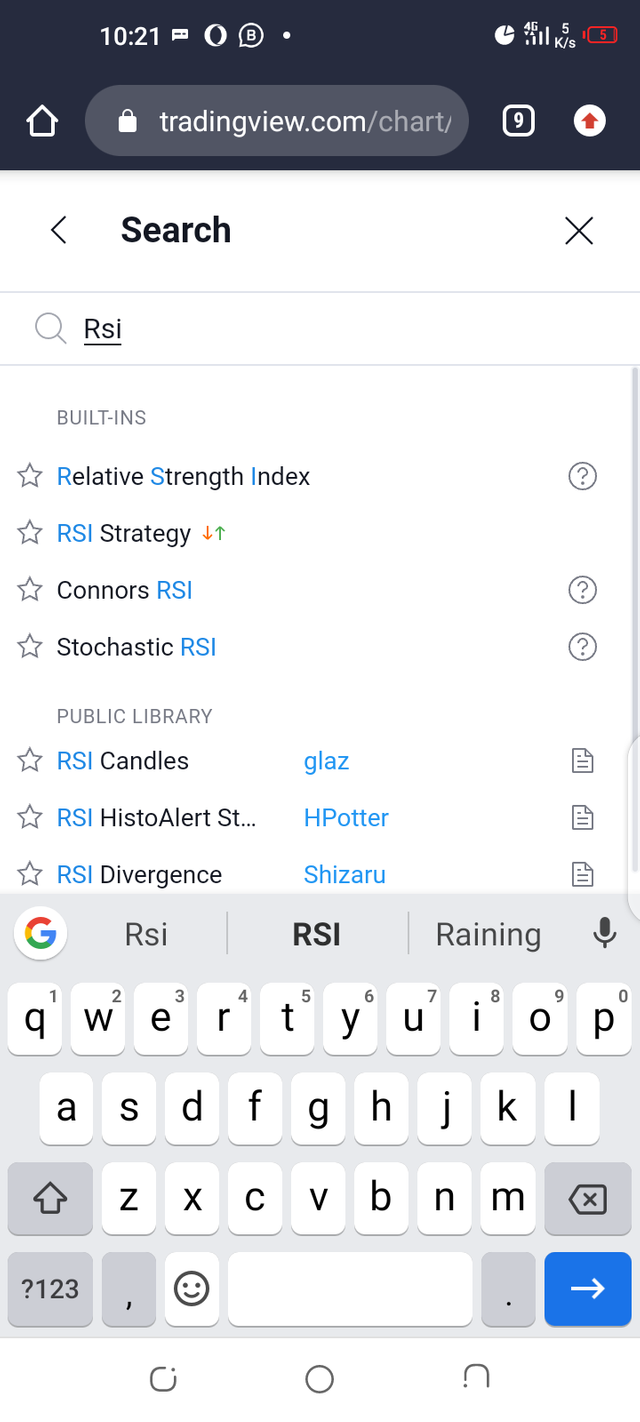
- 3
On the sreach bok, type RSI and select relative market strength
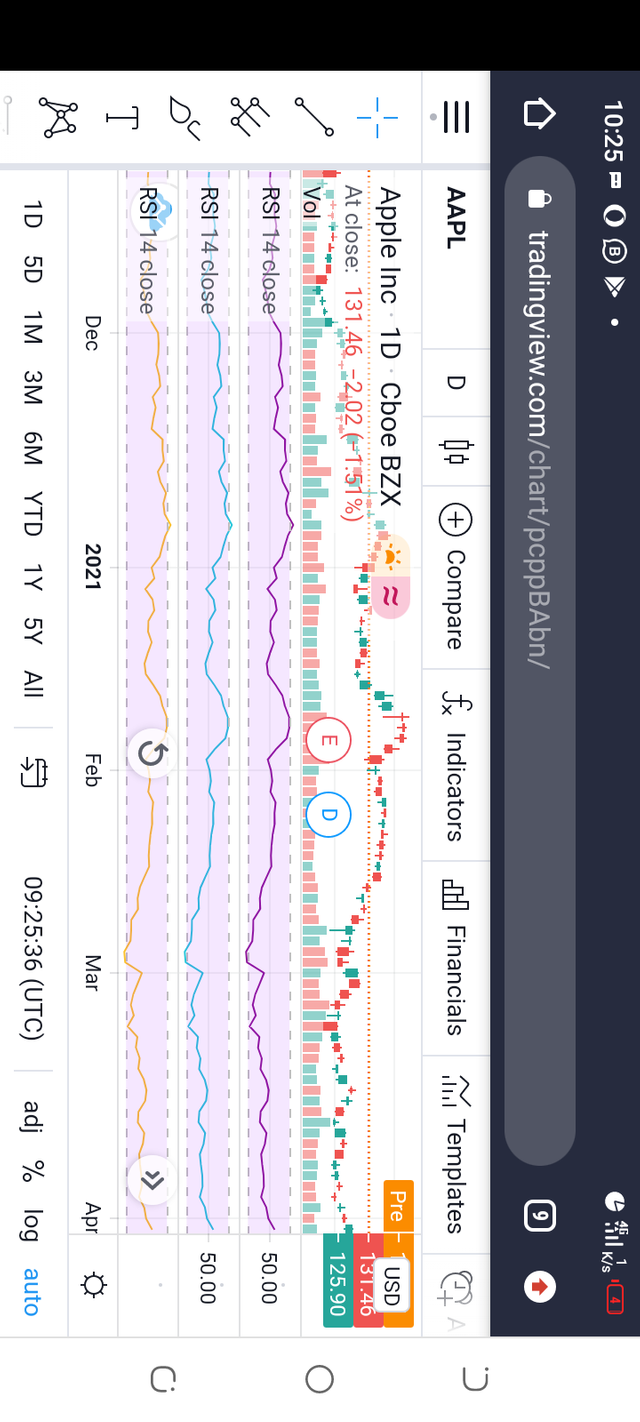
The chart will appear with RSI like this.
.jpeg](https://steemitimages.com/640x0/https://cdn.steemitimages.com/DQmd6uQrfbbvgiC6DRnpqJ5NRwi4WsXmi4AgXpAYdyMP83L/images%20(11).jpeg)
Overbought Signal.
The Overbought Signal is indicated whenever in bullish market trend where the RSI moves above 70 to 100. This is as a result of the demand is higher than supply and moves the price above the 70 limit. At this limit, the price change can bounce back.
Oversold Signal.
The oversold signals are identified as the RSI moves below 30. There's more of supply than the demands thereby shifting the price level below 30. This indicate the reversal of prices at this limit.
Use of Stop loss limit to identify the real RSI?
.png)
The stop loss limit aids a trader to identify the real RSI from the fake one because it can record the limits of the price fluctuations in the chart.
.jpeg)
The straight line drawn shows the stop loss limit and helps to continue trade. When the price dips deeper beyond the limits that's the point to reduce more loss by cancellation of the trade.
Explain briefly the trading pair of choice using RSI indicators.
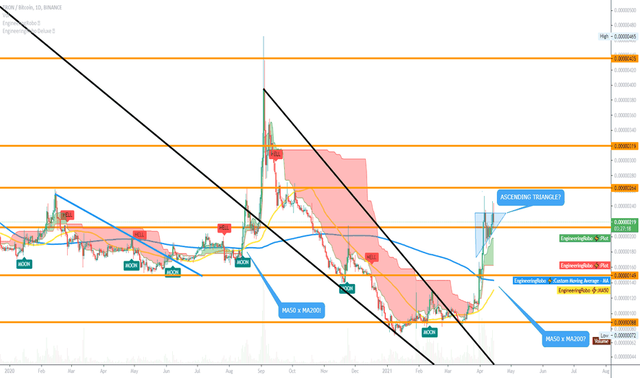
However, from the beginning of the chart, the price dips below and keep going down and when it was a Feb and March. There's a sharp increase in the price of the pair. It maintain an average range in price change from April to May but fall sharply on June. RSI indicators shows that the price fall within the oversold levels and there's a sharply price rebouced.
Technical skills and knowledge is very important in every trading including crypto currencies transaction. To avoid unnecessary loss of resources and assets, a careful study of the market trends should be adopted. RSI is the best indicator used in the study of market trends and great technical skills and knowledge will be highly appreciated.
Hello @sammylinks,
Thank you for participating in the 4th Week Crypto Course in its second season and for your efforts to complete the suggested tasks, you deserve a 4/10 rating, according to the following scale:
My review :
An article that misses a lot of focus on the answers to the questions, such as using a chart that does not contain the RSI and explaining it. In addition, the rest of the questions were not in-depth and analyzed.
Thanks again for your effort, and we look forward to reading your next work.
Sincerely,@kouba01