[Crypto Trading Using TRIX Indicator] - Crypto Academy /S6W3-Homework Post for kouba01
Hello Everyone!
This is Sami Zuberi , hope you all are well. I am exceptionally hope set aside a few minutes for perusing my post for @kouba01 and valued it. Here i am going to impart my views on "Trix Indicator". So how about we begin
Made this above poster on canva
Question 1.
Discuss in your own words Trix as a trading indicator and how it works
The Trix indicator, like all other moving average indicators, is a moving average indicator. The Trix indicator, commonly referred to as the triple exponential average indicator, was created in the 1980s. The Triple Exponential Moving Average Trix is a technical indicator that allows traders to see the price motion quickly. TRIX is made up of three moving average indicators that are designed to analyze and filter out irrelevant signals.
The Trix indication is a momentum-based indicator that corresponds to a single particular line that fluctuates through positive and negative values, with zero (0) as the midway figure. The Trix can also be used in conjunction with other indicators. It will assist traders in locating the optimal entry points. When trading with any asset, the Trix indicator can assist traders recognize a bearish or bullish trend when such market price gets overvalued.
This process is performed by combining three exponential moving averages to calculate the Trix indicator. This indicator aids in identifying price peaks and price regions. The TRIX is unusual in that it filters out irrelevant data and produces very accurate indications that may be used in trading. This indicator functions as an oscillator, with the primary objective of identifying overbuying and overselling areas in the market. This indicator is also used to check the accuracy of signals and predictions in order to prevent making false market entrances.
How does Trix indicator work?
The Trix indicator operates similarly to exponential moving average, except that it takes more additional factors or variables. Trix indicator however is put under the price that unlike EMA which is supposed to span prices. The Tric indicator is intimately linked to the EMA's operation. On a complicated chart with candlesticks, the Exponential Moving Average (EMA) indicators are recognized for making straightforward trend detection. The EMA seems to be a basic technical indicator which is formed in manner of a line to indicate the current marketplace.
When the indicator flow passes the zero line to the top in a manner that the indicator is ascending, the TRIX signal buys. When the Trix indication is used as a momentum indicator on a chart, the momentum will grow when strong and positive signals are present and drop when unfavorable or negative indications are present. This movement of the Trix line provides traders with a variety of trading indications.
Question 2.
Show how one can calculate the value of this indicator by giving a graphically justified example? how to configure it and is it advisable to change its default setting?
That indicator is normally produced using the closing price's MA which is moving average. EMA1, EMA2, and EMA 3 are the three EMA indicators that make up the TRIX. The following are the calculations:
EMA 1 = EMA[close] (The exponential moving average of the current price valuation).
EMA 2 = EMA[EMA 1]
EMA 3 = EMA[ EMA 2]
then x = current price,
The generic formula can therefore be obtained as follows:
TRIX = [(EMA 3 (x) - EMA 3 (x - 1)) / (EMA 3 (x - 1))]
The triple exponential moving average (EMA) is derived from the method for determining an asset's closing price.
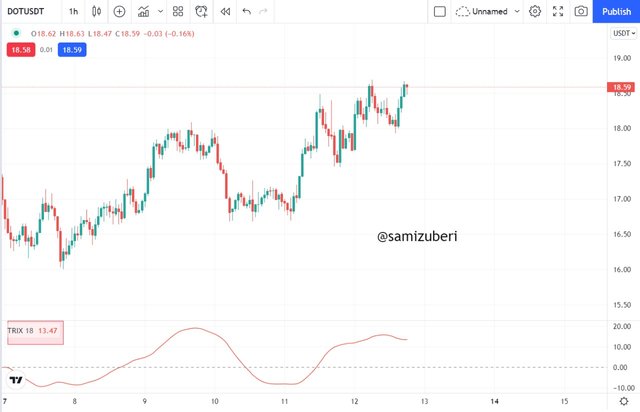
The current price of the TRIX indicator could be seen in the above figure, where the TRIX value was 13.47 after the multiple EMA's were computed.
How to Configure its settings
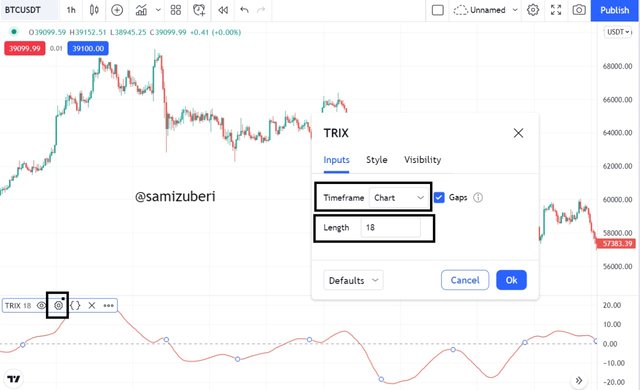
For configure the TRIX indicator, go to settings and select the length you wish for the TRIX. In my instance, I kept the length at its default of 18 to avoid any problems well with modification.
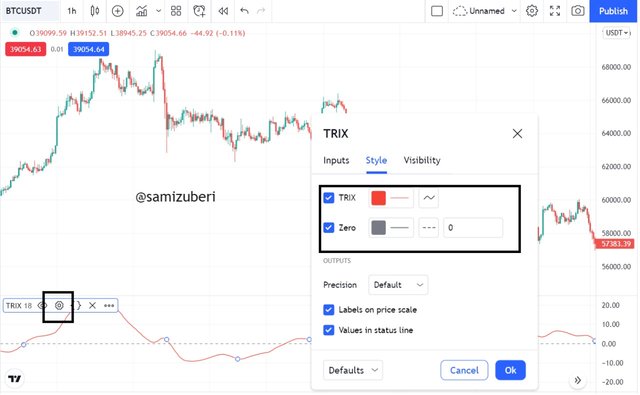
The TRIX also has style settings, which we may use to modify the opacity of the TRIX line from there. The zero line was also altered from dots to dashes as you can see in below screenshot.
Is it advisable to change its default settings?
As trading evolves, traders should adjust the indicator parameters according to their desires. As not all crypto assets behave the same in the marketplace, it's essential and advised to always modify the default parameters of this indicator. This indication may be highly useful when used in conjunction with other indicators.
Question 3.
Based on the use of the Trix indicator, how can one predict whether the trend will be bullish or bearish and determine the buy/sell points in the short term and show its limits in the medium and long term. (screenshot required)
Identifying Trend, Buy/Sell Opportunities using Trix Indicator
The Trix indicator does not necessarily anticipate trends; rather, it assists investors and traders in identifying potential regions of buying and selling opportunities by crossing up or down the indicator's zero (0) midway value. However, the trend can also be determined based on its smoothed portrayal of price data, where the Trix criterion often corresponds with the as a whole bullish trend motion of price, while the selling opportunities recognized by the indicator correspond with the overall bearish pattern movement of price.
- In a bullish environment, the Trix indicator finds purchasing prospects by crossing the oscillating Trix indicator line above the zero (0) center, leading to positive indicator readings. The crossover implies that market actors' general attitude is positive, implying that buyers have price regulations.
In a bearish condition, the Trix indicator detects selling options by passing the oscillating Trix indicator line below the zero (0) midway, leading to negative indicator readings. The crossover implies that buyers and sellers' general mood is pessimistic, implying that sellers have price control.
On a short-term basis, the Trix Indicator
Short-term usage Trix indicator necessitates the use of shorter period parameters and trading on a short timeframe. As the smoothed EMA calculation interval is lowered, the Trix indicator should provide trade indications more frequently. Because the interval and period settings are deemed to be short, this most of the time results in a false or randomized signal. I utilized a period setting of 15 Minutes timeframe to show the effect of employing the Trix indicator on a short-term basis. Consider the following graph:
On a medium to long-term basis, the Trix Indicator
Likewise, employing the Trix indicator over the intermediate to a long time necessitates using greater period parameters and trade on a higher timeframe. As the smoothed EMA computation period is raised, the Trix indicator should provide fewer trade signals. Most of the moment, this correlates to an appropriate signal because interval and period settings are deemed to be greater, allowing the price to vary. I utilized a period option of 18 on a 4-hour timeframe to give the illusion of employing the Trix indicator on a medium to long-term basis. Evaluate the graph:
Question 4.
By comparing the Trix indicator with the MACD indicator, show the usefulness of pairing it with the EMA indicator by highlighting the different signals of this combination. (screenshot required)
MACD and Trix Indicators
As already noted, the Trix indication and the MACD indicator are identical in terms of how price data is displayed, with the underlying difference being the smoothed effect given to the EMA utilized in the Trix indicator's computation. Though the EMA has a tendency to respond quickly to price movements, the flattening function mitigates this impact while providing a smooth indication of motion. Both the Trix and MACD indicators should ideally fluctuate about the zero (0) midway, creating indications with a crossover up or down midway.
Another distinguishing aspect is the way the indicators respond to price fluctuations. The MACD tends to react to price changes faster because it includes for more randomized price action than the EMA smoothed Trix indicator, which ignores randomized price action. Typically, the MACD line crosses above zero (0) quicker than the Trix indicator. Consider the graph below to see what I mean:

Regardless of how the Trix indicator smooths its portrayal of price action, the MACD indicator line prefers to pass over the zero level well before the Trix indicator line, shown above.
Question 5.
Interpret how the combination of zero line cutoff and divergences makes Trix operationally very strong.(screenshot required)
Divergence refers to the price of an asset as well as the indicator moving in opposing directions, and then we can say that both price movement and the indicator are going in different directions. We all know that in order to be assured of the market trend, price should move in the same direction as the indication. However, when they both go in opposite directions, we call this divergence. The purpose of divergence on a price chart is to prepare traders' minds for a potential trend reversal that is about to occur in the market. Let's have a look at the image below to see if there is any discrepancy.
When we observe the zero line cutoff, we understand the price is about to move in a certain manner. It is also an indication that the trend is low at that time, and a trend reversal on the other side is probable.
Question 6.
Is it necessary to pair another indicator for this indicator to work better as a filter and help eliminate false signals? Give an example (indicator) to support your answer. (screenshot required)
Because no indication is 100 percent successful, combining it with the Trix indicator is a requirement for all traders who want to limit loss and maximize profit. The study of cryptocurrency trading should be done with the help of two or more indicators.
I'll be using the RSI indicator in conjunction with the Trix indicator for this work. As we all know, RSI indicates oversold at 30 and below and signals oversold at 70 and above. When the RSI is over 50, it indicates a buying opportunity, and when it is below 50, it indicates a sell signal. For this, we want to identify buy and sell zones and validate them with the Trix and RSI indicators.
Buy Entry
To enter a buy position, the Trix indicator must cross above the center point, and the RSI indicator must be above the 50 levels. The image above illustrates that all of the parameters are taken into account.
Sell Entry
To enter a sell position, the Trix indicator must fall below the middle point, and the RSI indicator must fall below the 50 level. The image above illustrates that all of the parameters are taken into account
Question 7.
List the pros and cons of the Trix indicator.
Pros of Trix Indicator.
It predicts the direction of the market's primary trend with a high precision of accuracy. Traders can ensight the current market.
However when dealing with longer time frames, it filters out noise. When trading reversals, TRIX displays divergences, which may be quite useful.
It aids the trader in gaining a better understanding of price movement by removing the frequent price swings. This indicator is quite simple to comprehend, and it functions in a straightforward manner.
This indicator generates indications that indicate the finest sale and purchase situations. Other technical indicators may simply be combined with the indicator.
Cons of Trix Indicator.
The TRIX indication should not be utilized as a stand-alone indication. The fact that it provides signals with a slight latency.
When the market is very volatility, it is less dependable since it reacts to the price very quickly.
It has the tendency to bring traders into the market after the price has already risen significantly. Because the TRIX indicator is too filtered, it misses certain critical data.
- When the market is trading in a range, the signal provided will be unclear.
Question 8.
Conclusion.
I conclude that professor gave us a very informative lecture through which I learned more about Trix indicator. When it comes to trend detection, the Trix indicator is a great tool to utilize for both long and short term monitoring. The TRIX indicator instructs investors on how to interpret signals and walk with the trend in order to earn from the market. When compared to other indicators such as the EMA indicators, the Trix indicator has shown to be a better alternative due to the way it assists to filter noise via its flattening capacity.
That's a market indicator that oscillation line's primary function is to indicate overvalued and overselling areas. As the indicator tends to deliver a smoother signal, the TRIX indicator is a mixture of three moving average indicators. This indication was created in order to smooth out the three EMAs that were utilized in the computation.


