Crypto Trading Strategy with Triangular Moving Average (TRIMA) Indicator - Crypto Academy / S6W4 - Homework Post for @fredquantum.
Hello Everyone!
This is Sami Zuberi , hope you all are well. I am exceptionally hope set aside a few minutes for perusing my post for @fredquantum and valued it. Here i am going to impart my views on "Crypto Trading Strategy with Triangular Moving Average (TRIMA) Indicator". So how about we begin.
Made this above poster on Canva

Question 1.
What is your understanding of the TRIMA indicator?
The TRIMA indicator is one of the moving average indicators developed to address issues with the basic moving average indicator. It is a modified moving average indicator that reduces market disturbance and highlights price movement trend. From its double-average of the asset's price, the triangular moving average may be considered to be twice smoothed, presenting its arc in a more distinct wavelike manner.
The TRIMA is built on the foundation of the Simple Moving Average indicator, which indicates the principles of moving average indicators. On the price chart, the TRIMA produces a line that tracks the price fluctuation through time. TRIMA is a highly helpful indicator that prevents indicators from reacting quickly to elevated cryptocurrency marketplace. It is a more appropriate type of moving average that clearly indicates the trend of an assets on the crypto chart, allowing traders to quickly identify the market's trend condition and determine entry as well as exit.
It is weak in reacting to market impacts because to the double averaging noticed when computing its value, which aids in filtering noise in trading that would otherwise occur from inaccurate signals in the market. The TRIMA may be used as a more realistic description of our Simple moving average, preventing lagging and detecting patterns on our graphs. TRIMA may be used to trade rollbacks by combining it with other indicators and placing buy and sell orders. This means TRIMA takes longer to deliver signals, but after the market noise has subsided, TRIMA offers the best indications.
Question 2.
Setup a crypto chart with TRIMA. How is the calculation of TRIMA done? Give an illustration. (Screenshots required).
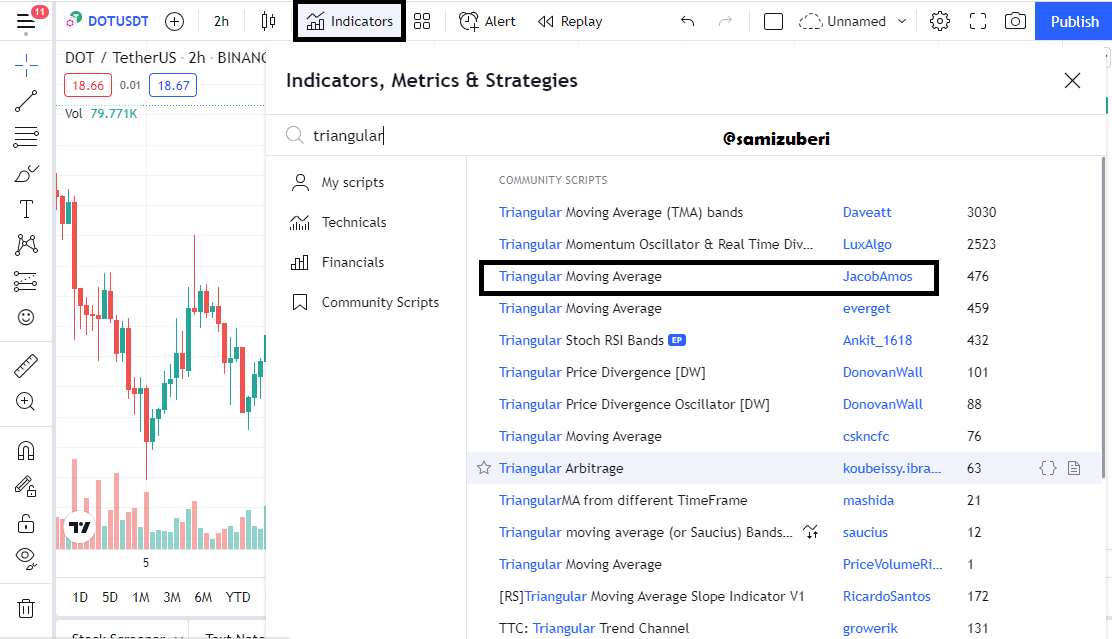
The tradingview site would be used to rapidly explain how to set up a TRIMA indication on a chart.

To use this platform for adding the TRIMA indication to my chart, go to the chart page and choose indicators. On the next page, go to the search box and enter in Triangular Moving Average. When this is complete, I would just select the name of my indication that displays on the screen.

Calculation of TRIMA :
Because the TRIMA is a double flattened variant of the SMA, the TRIMA formula would include the SMA's.
Therefore,
SMA= (P1 + P2 + P3 + P4 + P5... + Pn)/n
As P1 to P5 represent the pricing of asset at each period, "Pn" represents the pricing at the most recent instance, and "n" represents the total number of periods utilized. The TRIMA may now be calculated by adding together the values obtained from each SMA calculation and dividing them by the total number of periods utilized in the calculations.
TRIMA = (SMA1 + SMA2 + SMA3 + SMA4 + SMA5... + SMAn)/n
TRIMA = Sum(SMA values)/n is another way of expressing it.
Question 3.
Identify uptrend and downtrend market conditions using TRIMA on separate charts.
Identifying Uptrend using TRIMA Indicator :
The TRIMA indicator determines the key market trends based on the indicator route's position up or down price, as well as the indicator line's tilt slopes. When the price of a coin moves above the TRIMA line, it indicates that the market is in an uptrend. The bullish indications are generated as a result of this. The angle of such indicator lines should be increasing upwards in the same direction as price movement without switching to validate the trends. If the TRIMA line has come underneath the price, we can readily forecast an uptrend because it is a strong indicator of the price's positive turnaround.
Take a look at the graph below:

With price action crossing above the indication line, the TRIMA indicator indicated the bullish trend. The market is currently going above the TRIMA indicator, as can be seen.
Identifying Downtrend using TRIMA Indicator :
Another market trend is the decline or bearish tendency. When the price of a coin moves below the TRIMA line, it indicates that the market is in a downturn. The price is reversing bearishly, which is a favorable indication. We had to double-check that the TRIMA indication was decreasing. Take a look at the graph underneath.

When price action crossing below the TRIMA signal line, the TRIMA indicator displayed the bearish trend. The market appears to be moving below the TRIMA signal.
Question 4.
With your knowledge of dynamic support and resistance, show TRIMA acting like one. And show TRIMA movement in a consolidating market. (Screenshots required).
Dynamic Support and Resistance, similar to. TRIMA, as I quickly described above, is a distinct indication obtained from Moving Average Indicators owing to the fact that they will be trend-based indicators. Broadly said, these sorts of indicators are monitored to follow price patterns in the marketplace.
During this process, they draw arbitrary lines that serve as a foundation for either Support or Resistance lines for price movements, which prefer to test these lines and proceed in their course.
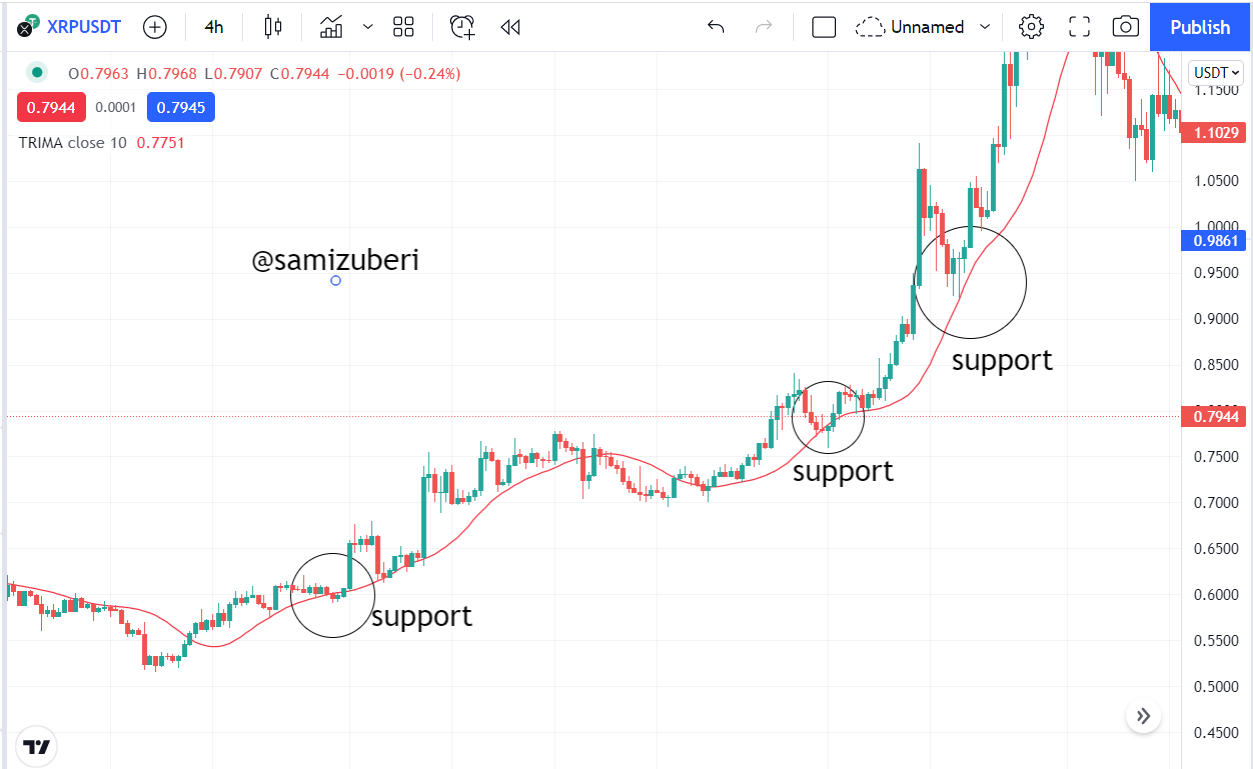
Dynamic Support level
The price movement and the TRIMA indicator line are both moving higher, and the price trend is rechecking on this indicator line, which operates as an unseen support level known as variable support. An example chart illustration of the TRIMA indicator line serving as a dynamic support point to the price movement can be seen here.
Resistance level
In this case, the price movement and the TRIMA indicator line are both moving lower, and the market price is rechecking on this indicator line, which functions as an unseen resistance level known as variable resistance to it. An example chart illustration of the TRIMA indicator line serving as a dynamic resistance barrier to the price movement can be seen here.

Question 5.
Combine two TRIMAs and indicate how to identify buy/sell positions through crossovers. Note: Use another period combination other than the one used in the lecture, explain your choice of the period. (Screenshots required).
Buying
Purchasing Scenario Using TRIMA Crossover Crossovers, as we all know, occurs when two of these indicators are combined on our graph. In this scenario, the short and long periods are adjusted to allow the short period to respond more precisely to the trend line, whereas the long period simply has a less reactive impact on marketplace disturbance.
TRIMA-10 will be my short term and TRIMA-20will be my long time for this objective. For me to perform a Buy entry approach, the marketplace must be in an Uptrend Scenario-based only on a pattern.

Selling.
Crossovers of this sort must be noticed in the opposite direction of the scenario already developed for the purchase setup point. TRIMA-10 will be my short term, and TRIMA-20 will be my lengthy period for this objective. In order for me to perform a Sell Entry stance, the marketplace must be monitored in a downtrend scenario solely from a trend reversals stance.

Question 6.
What are the conditions that must be satisfied to trade reversals using TRIMA combining RSI? Show the chart analysis. What other momentum indicators can be used to confirm TRIMA crossovers? Show examples on the chart. (Screenshots required).
For bullish condition
Our two TRIMAs, the 30 periods and the 10 periods must be included in the chart.
My RSI indicator must be shown in the graphic as well.
For a positive reversal to be verified, the RSI indicator must fall below the oversold level of 30.
To verify a bullish reversal, the lower period must cross over the upper period; in my example, the 80 periods should cross over the 100 periods.
Of course, I will establish my take profit and stop-loss settings, with a very tight stop loss just below the support level of the two TRIMA crossovers.

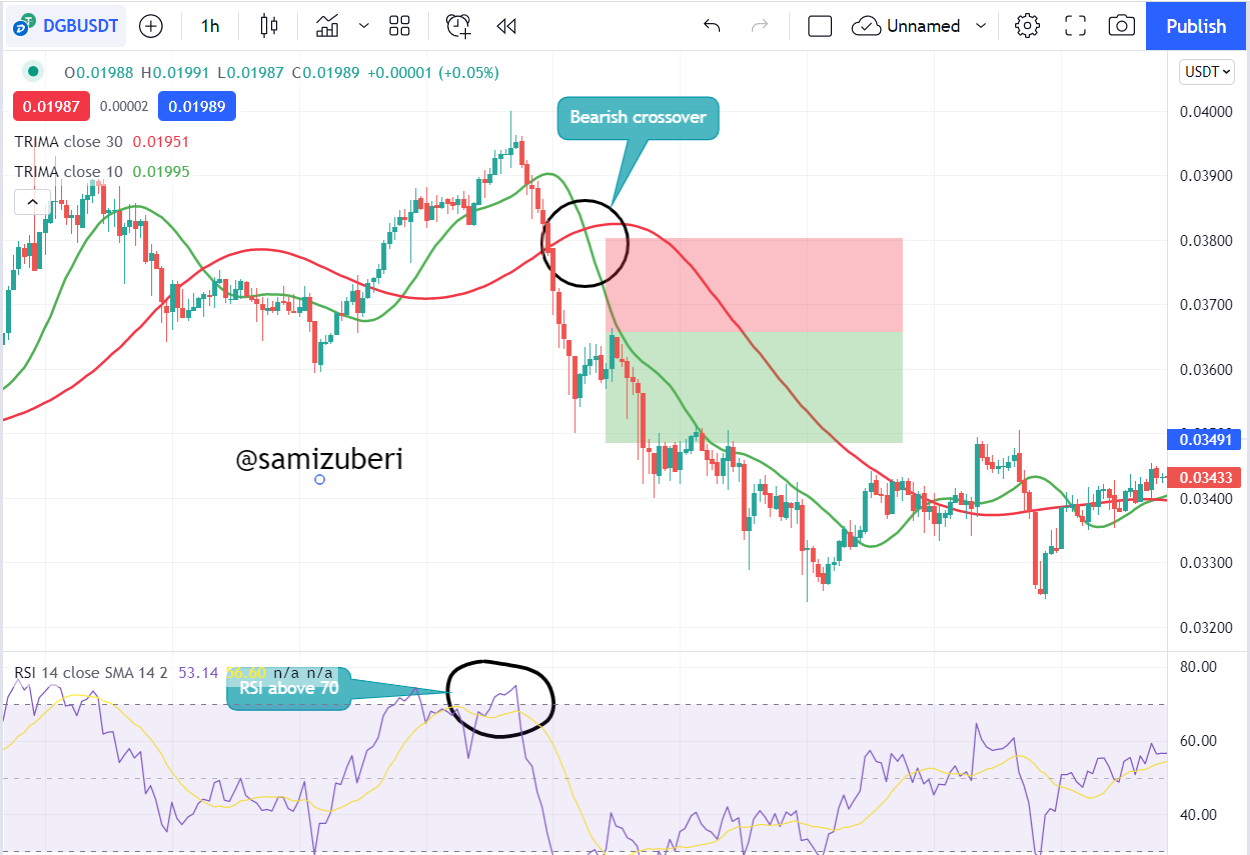
For Bearish condition
On the chart, the RSI indicator should be added.
Two TRIMAs, one for a short term and one for a long duration, should be added to the chart.
The RSI indicator must reach the overbought zone to indicate that the marketplace is significantly overpriced, indicating deep instability.
The longer time must be greater than the shorter time.
Whenever there is a breakthrough, make sure that the breakthrough candlestick is thick capable of providing strong evidence.
Appropriate stop-loss slightly above the crossover over
Combining with ROC Indicator
Now, I'll pair the ROC Indicator with TRIMA since the ROC is a good momentum indicator that can corroborate our indication with TRIMA. But let me just explain you about the ROC Indicator.
The ROC Indicator oscillates between the positive and negative zones. Whenever the ROC goes away from the zero line, it is regarded a purchase indicator. When the ROC travels away from the zero line, it is regarded a sell indication.

As seen in the preceding illustration, whenever the ROC goes near positive, the price rises upward, and when the ROC moves into negative, the price falls lower.
Question 7.
Place a Demo and Real trade using the TRIMA reversal trading strategy (combine RSI). Ideally, bullish and bearish reversals. Utilize lower time frames with proper risk management. (Screenshots required).
Now, I will place a trade setup utilizing the TRIMA Indicator in conjunction with the RSI Indicator, and I will outline correct analysis in this trade arrangement.
SELL SETUP.

The longer TRIMA has crossed over shorter TRIMA and is above the shorter TRIMA, as shown in the above illustration. Then I checked at RSI, and RSI has lately tested the Overbought zone, which verifies my indication. I've placed a stop-loss order immediately above the resistance level.
At that price, I've opened a trade on Binance Exchange. Here is my trade information:

I have also placed a demo trade which you can see below.

Question 8.
What are the advantages and disadvantages of TRIMA Indicator?
Advantages of Trima Indicator :
The TRIMA Indicator eliminates chart noise and disruption. It absolutely eliminates the susceptibility of market response.
It doesn't react to vitality rapidly since it creates a smoother line with a SMA. TRIMA is slow to react to price changes. As a result, it may be used with both volatile and nonvolatile pairings.
Combining it with other technical indicators like the RSI improves its efficiency and satisfactory results. The Trima Indicator displays a certain set of data over period.
By staying below and above the price, it aids in the identification of locations of support and resistance. Trima can also determine the appropriate amounts of dynamic support and resistance.
Traders may use this indication to spot trend reversals and emerging trends. It's a trend-following indicator with more defined trend motions and directions, which traders like while trading.
Disadvantages of Trima Indicator :
The indicator still seems to be lagging. It takes a long time to respond to pricing changes, After the market has moved in a specific direction then we will receive a signal. Despite the fact that this function has been considerably decreased.
When used in a line chart, the Trima Indicator doesn't quite reflect the closing pricing.
TRIMA is not a stand-alone service. Using the TRIMA Indicator alone might lead to inaccurate signals.
Trima must be configured correctly before it could be used.
Conclusion :
The TRIMA indicator works by flattening the basic moving average values using a twofold smoothing function obtained by its calculation. This indicator aids traders in determining market trends and deciding what to do next in the market. Because no trading indication is 100 percent effective, the TRIMA indicator should be used in conjunction with other indicators to provide solid trade signals. TRIMA provides a clear picture. As a result, the noise is reduced. It results in a more accurate depiction of the market trend. However, we should be cautious while utilizing TRIMA since it can sometimes yield incorrect results. It has a slow and lagging temperament.