Basic trading strategy using the Harmonic AB = CD + Fibonacci Pattern - Crypto Academy | S4W2 - Homework position for @lenonmc21
Hello Everyone!
This is Sami Zuberi , hope you all are well. I am exceptionally hope set aside a few minutes for perusing my homework post for @lenonmc21 and valued it. Here i am going to impart my views on "Basic trading strategy using the Harmonic AB = CD + Fibonacci pattern". So how about we begin
Made this poster on canva

Question 1.
Define in your own words what Harmonic Trading is?
Harmonic trading is a price-based analytical technique that use pattern identification strategies to assess and forecast market patterns in the future. In the financial markets, harmonic trading uses precise alignments of Fibonacci derived ratios to define distinctive price patterns. This technique implies that a trading pattern or cycles repeat themselves, much as many patterns and cycles do in life. Trading cycles of buying and selling may be measured and differentiated as unique technical entities in the financial markets. Trades are conducted at a price level when the cycle is shifting when these points are appropriately identified.
Harmonic Trading Discoveries :
The idea of harmonic ratio alignment was developed to differentiate identical structures as distinct trading scenarios, demonstrating that not all patterns are alike.
To differentiate structures, new harmonic ratios derived from the Fibonacci sequence were presented.
Determine a number of confirm techniques that may be used to confirm that pattern completions are legitimate trading opportunities.
The use of harmonic trading measurement techniques was successful in identifying important regions of support and resistance. Harmonic patterns function as structural cues that must be respected. Harmonic trading is a trading concept in which operators seek for particular patterns that coincide with Fibonacci numbers, which are unique numbers. Harmonic traders, in comparison to earlier technical analysis approaches, try to assess market changes but instead of respond to them through instantaneously. Based on historical performance, the general market ultimate success for harmonic patterns is greater. Furthermore, the majority of the harmonic patterns point to a strategy of inversion.
Question 2.
What is the Harmonic Pattern AB = CD and how to identify it?
Most harmonic pattern steps need the AB=CD pattern, which is a four-point price structure. The AB=CD pattern is made up of two price segments that are equidistant and have harmonic ratios. The most crucial price levels are the exact completion point of the AB=CD, while the BC points complete the area. In the market, the AB=CD pattern is a form of minimum energy wave in which each leg represents a component of a single full vibration. Further Fibonacci results in the reduction or extensions should be included in the structure. The significance of the AB=CD structure throughout all harmonic patterns varies depending on the context.
Identifying AB=CD pattern.
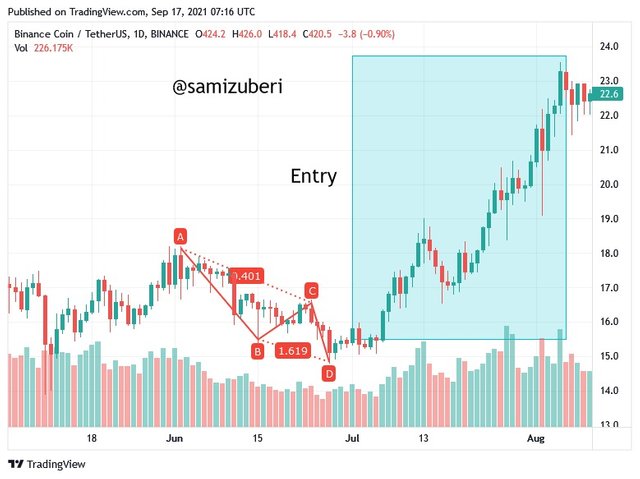
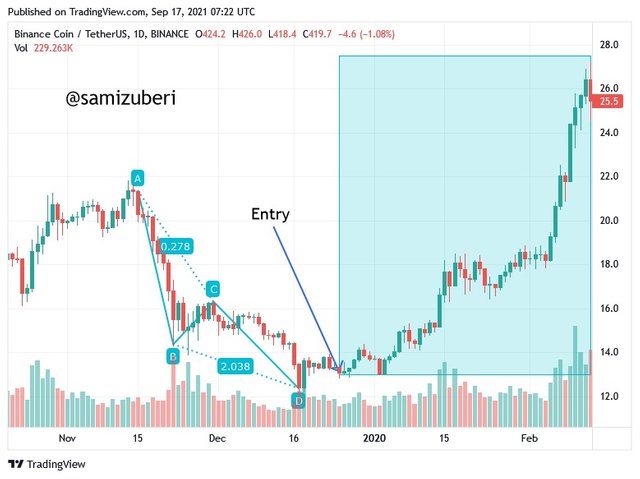
A B C D are four points that may be used to measure trends. The first leg of a trend is A to B, and the second leg is B to C. B to C is a retracement, and C to D is the following leg of the trend, which is the same as A to B.
The concept is that the projected length of C to D is equal to the anticipated length of A to B, making C to D the primary trade opportunity. Identify a trend or, to put it another way, look at the chart where the price was obviously at a base and then soared to the top, which is the first leg of the trend at point A, and we know that point A is the start of the trend and point B is the top. When the candle reaches the peak, which is point B, we begin to observe retracement, which gives us an indication of where to look for point C, which is where the trend will reverse. You can anticipate B to C to be a Fibonacci line from where B terminates. When it reaches the Fibonacci line, look for a reversal signal, which might be a support resistance zone. Now, the length of A to B is the expected line of C to D, so once you see this trend building, you wait for a pullback and then see some signals of reversal, and then you can get into the anticipation that C to D is equal to A to B, giving you a price valuation.
Question 3.
Clearly describe the entry and exit criteria for both buying and selling using the AB = CD pattern?
Entry Criteria (Buy & Sell) :
The first step we should do is to determine the pattern in which the four points A, B, C, and D are present. After that we need to make sure that C is between 61.8 and 78.6 percent of the Fibonacci Retracements, and therefore that D is somewhere between 127.2 and 161.8 percent. Fibonacci retracement levels are what they're called. And if it's not occur, then should dismiss this pattern as illegitimate, and search the market for another AB = CD pattern formation. When D corresponds to Fibonacci levels between 127.2 percent and 161.8 percent, then instantly come into the market.
Exit Criteria (Buy & Sell) :
Because no trade can be guaranteed toward being beneficial of the time, it's prudent to set a precautionary limit order just under the Possible Reversal Zone. As a result, the trend might either revert to the upward and keep following the present situation. You should terminate the trade using its actual benefit whenever the overwhelming evidence shifts with in reverse directions. At some few strokes over point D, set the stop loss. It's because if that C-D leg spreads further than this level, this should generally extend throughout this manner more far. Don't go into a trading and exit the market once the market exceeds a position where D could be located.
Question 4.
Make 2 entries (Up and Down) on any cryptocurrency pair using the AB = CD pattern confirming it with Fibonacci.
Conclusion :
I conclude that professor gave us a very informative lecture that helps me to learn more about Harmonic Trading. Harmonic trading is a valuation iterative framework that use trend recognition algorithms to evaluate and anticipate future market trends. The AB=CD pattern, which would be a four-point price structure, is required for most harmonic pattern steps. The AB=CD pattern is composed of two separated pricing segments with harmonic ratios. Harmonic patterns serve as crucial structural indications that must be taken into account. To discover possible trading opportunities, discern legitimate price patterns, and optimize all trading decisions, harmonic trading requires specific criteria.
Special mentions to ;
@lenonmc21