[Understanding Trends] - Crypto Academy / S5W1- Homework Post for @reminiscence01
This is Season 5 Week 1 of Steemit Crypto Academy and I'm writing homework task about "Understanding Trends " assigned by Professor @reminiscence01
Question# 1
a) What do you understand by a Trending market?
Trends simply means the direction of the movement of the market which in turn is determined by the changes in the price. A trending market simply means a market which is following a trend.
The price trends can be defined as the particular direction in which the price of the asset is heading. It can be up trending if the price of the asset is continuously increasing and it could be down trending if the price of the asset is continuously decreasing. The market at some times cannot be in any trend that is when there is a comparable buying and selling pressure and the price is equally controlled.
It is often said that the trend is only friend when trading in cryptocurrencies. That means when you are placing buying and selling positions you have to closely monitor the price changes in the past. Price movements are often cyclic and so are the trends the market seems to be making cyclic movements when the price increases then decreases then again increases etc.
The trend of many cryptocurrencies are affected by changes in the prices of Bitcoin and so it has a great impact on the overall trend of the market.
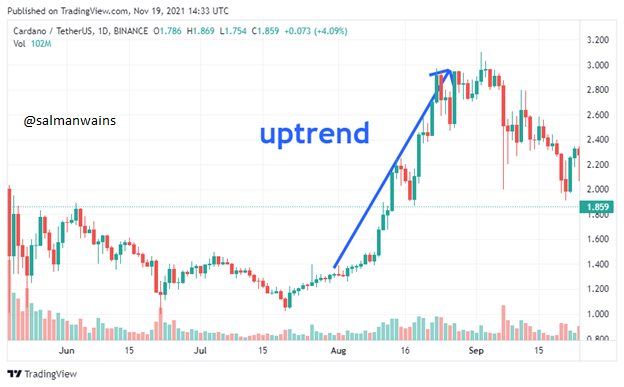
b) What is a bullish and a bearish trend? (screenshot required)
Bullish and Bearish are the two types of the trend usually seen in the market.
Bullish trend:
It is also known as the uptrend or the upward trend. It is marked by continuous higher highs and or higher lows in the market. It is marked by a continuous increase in the price of an asset and a higher buying pressure.
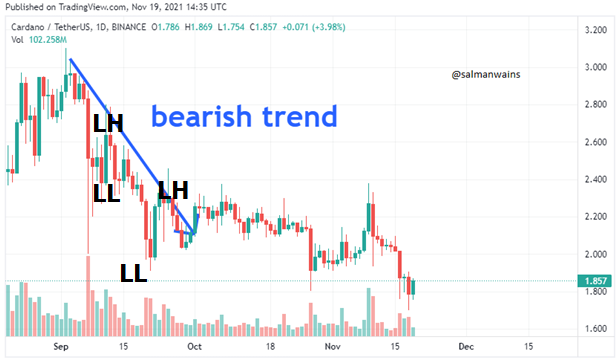
Bearish trend:
A bearish trend is also known as the downtrend. The price line during the downtrend shows continuous lower highs and lower lows. It is marked by a decrease in the price of an asset and an increase in selling pressure.


Question# 2)
Explain the following trend identification and give an example of each of them. (Original screenshot needed from your chart). Do this for a bullish and a bearish trend.
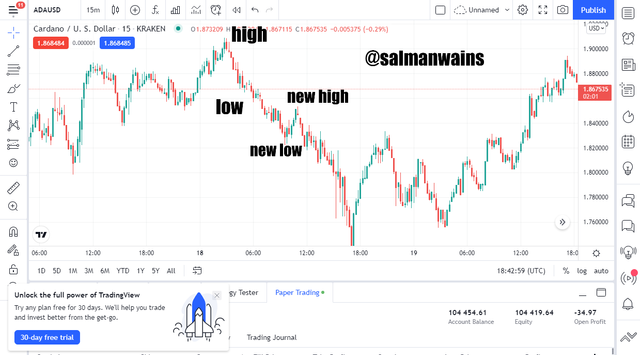
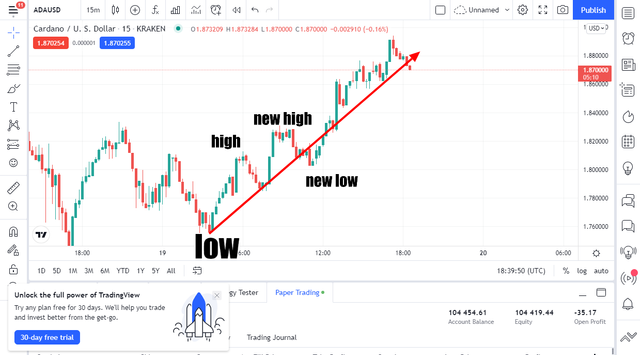
i) Market Structure.
ii) Trendlines
i) Market Structure.
The structure of the market is defined as the visual view of the price line at different points of time in different trends.
Bullish trend:
During a bullish trend we see a rising market structure. It consists of higher highs and higher lows. This means that there is a gradual increase in the price so the price at which the market closed currently is greater than its last close and every high presents us with a selling opportunity and every low a buying position.

Bearish Trend:
The market structure during a bearish trend shows lower highs and lower lows. It represents that the price of the asset is gradually decreasing and the market structure is thus a descending slope. The current closing price is lower than the previous.
ii) Trendlines
Trendlines are the most commonly used tools on a chart to identify and specify trends. When you mark a trend you actually identify the direction of the market.
Bullish trend:
To indicate a bullish trend using the trend line we draw a line that at least joins to the low point. After drawing a trend line we will see the price line trading above this line above the trend line.
Another thing we see is that the price will respect this line and will bounce back many times when it touches or comes closer to it. Thus it will act as a dynamic support. Once the price line breaks the dynamic support a trend reversal can be predicted.
Bearish trend:
To indicate a bearish trend we connect at least to high points in a down trending price action. The price line will be seen trading below the trending line and this trend line will act as a resistance where the price will bounce back many times.
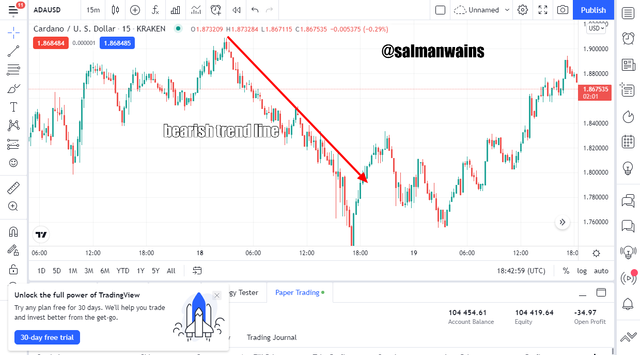
The bearish trend is invalidated when we are no longer able to join two consecutive high points and this break or invalidation can be used to predict trend reversals.
Question# 3)
Explain trend continuation and how to spot them using market structure and trendlines. (Screenshot needed). Do this for both bullish and bearish trends.
Trend continuation simply means when the trend maintains a direction whether up trend or down trend. The market structure as can be observed from the above charts is not a straight line or regular; it keeps on oscillating between highs and lows.
When a price breaks a resistance or support the price retraces back to this level as the traders are taking their profit at this time. When we identify whether the trend will break or continue on the basis of the market structure we can place the right buying and selling position.
Trend continuation using market structure
Market structure can give us an indication whether the trend will continue or not. When the market is up trending we see highs that are higher than the previous. After that the trend may begin to weaken and we may see a high that is lower than the previous high.
This may indicate that the buying pressure is not enough to hold the price and sellers are entering the market. There might be an impulsive move and the price may try to move back in its original direction. This is called the price retracing the previous support level.
For a bearish trend if the next high formed is higher than the previous low and the next low point formed is lower than the previous low we see a trend continuation.
For a bullish trend the new low is not lower than the previous low and the high point is higher than the previous high we see a trend continuation.
If during a downtrend the price makes a high higher than the previous high followed by a low higher than the previous low the trend is weakening and a reversal can be expected similarly in an uptrend if the new high is lower than the previous low it also indicates that the trend is losing its strength.
Trend continuation using the trend line
In the above question we saw how a trend line can be drawn and these trend lines can act as dynamic support and resistance. Trend lines locate continuing trends based on the highs and lows.
The price retraces this level and bounces back several times. Every time the price comes closer to these support and resistance levels.
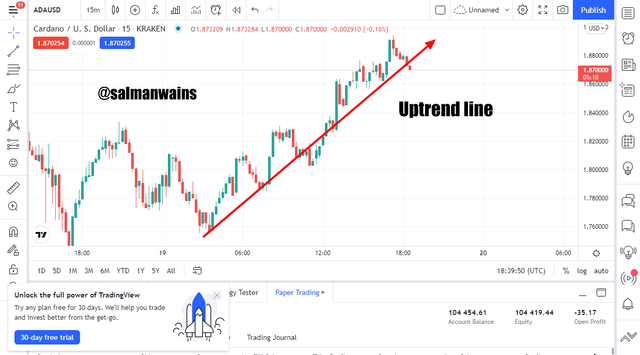
When the price breaks this line the trend is invalidated and reversal can be expected. In the chart below we see a bullish trend indicated by an uptrend line. We can clearly see how the price retraced the trend line before finally breaking through it.

Question# 4)
Pick up any crypto-asset chart and answer the following questions -
i) Is the market trending?
ii) What is the current market trend? (Use the chart to back up your answers).
In this question I will be using the following ADA/USD chart
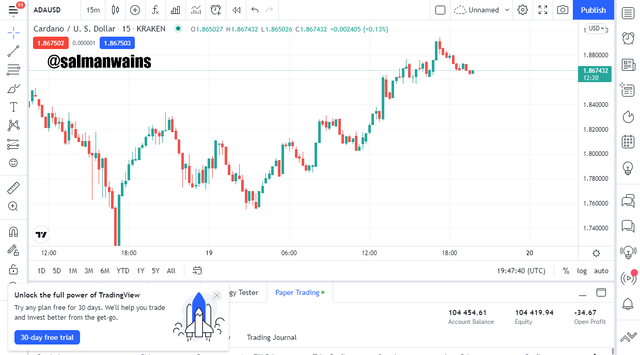
Here the time frame we have chosen is 15m
i) Is the market trending?
In the ADA/USD chart if we draw a trend line we can see that the market was initially in an uptrend. The market structure shows that the new highs were higher than the previous highs. But for the trend to continue the price should reject the dynamic support and continue in the previous direction but from what seems now the price line could be breaking the support anytime soon.
However it would be too early to say that it is a breakout or trend reversal as the price has not shown a low that is lower than the previous low.
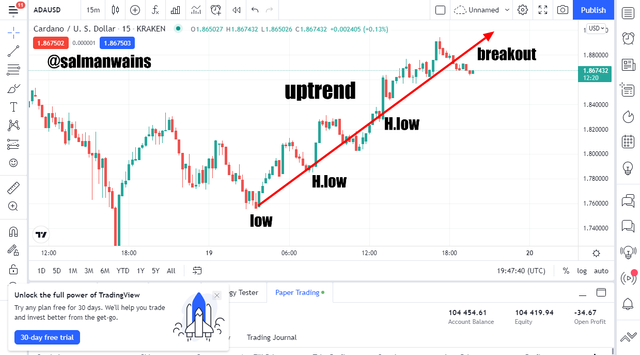
ii) What is the current market trend? (Use the chart to back up your answers).
In the above chart it is clear that the market structure is now in the breakout phase. If at this point the price makes a low that is lower than the previous low then trend reversal towards a down trend can be confirmed but if climbs back after retracement the up trend can be continued.
But according to the trend line strategy the market is breaking the current trend as it has not respected the dynamic support level.
Conclusion:
I have learned a lot about Trends and Trend lines after doing Homework task this week. Now, after completing this task, I must say that
Trend lines and understanding of the market structure are two very important phenomena in crypto trading. A clear understanding of the trends, trend continuation and reversals is very important for making the right decisions.
CC:
Club5050 Eligible
Hello Professor @reminiscence01,
it's been more than 48 hours and my homework task isn't checked yet. Please have a look
Thank You
It will be checked soon.
Thank You
Hello @salmanwains , I’m glad you participated in the 1st week Season 5 of the Beginner’s class at the Steemit Crypto Academy. Your grades in this task are as follows:
Recommendation / Feedback:
Thank you for participating in this homework task.