[Head and Shoulders and Inverted Head and Shoulders Pattern] - Crypto Academy || S5W2- Homework Post || For Professor @utsavsaxena || By @salmanwains
This is Season 5 Week 2 of Steemit Crypto Academy and I'm writing Homework Task about "Head and Shoulders and Inverted Head and Shoulders Pattern" assigned by Professor @utsavsaxena

Question# 1
Explain Head and Shoulder and Inverse Head and Shoulders patterns in details with the help of real examples ? What is the importance of volume in these Patterns (Screenshot needed and try to explain in details) ?
We know that price charts show a recurring pattern. Which means if the price goes up it will surely go down. That is why we see repetitive patterns that predict the upcoming trade signals. One such patterns is the head and shoulder pattern. Traders often use these patterns to decide weather to ride on the pattern or to discontinue trading in the particular direction.
The head and shoulder and the inverse head and shoulder pattern are the reversal patterns. Which predict nearing trend reversals.
Head and Shoulder Pattern
The head and shoulder pattern are basically peaks form the price at the end of the bullish pattern. The shoulders are lower in height than the head. As It predicts bearish trend it is often referred to as the bearish-bullish trend reversal.
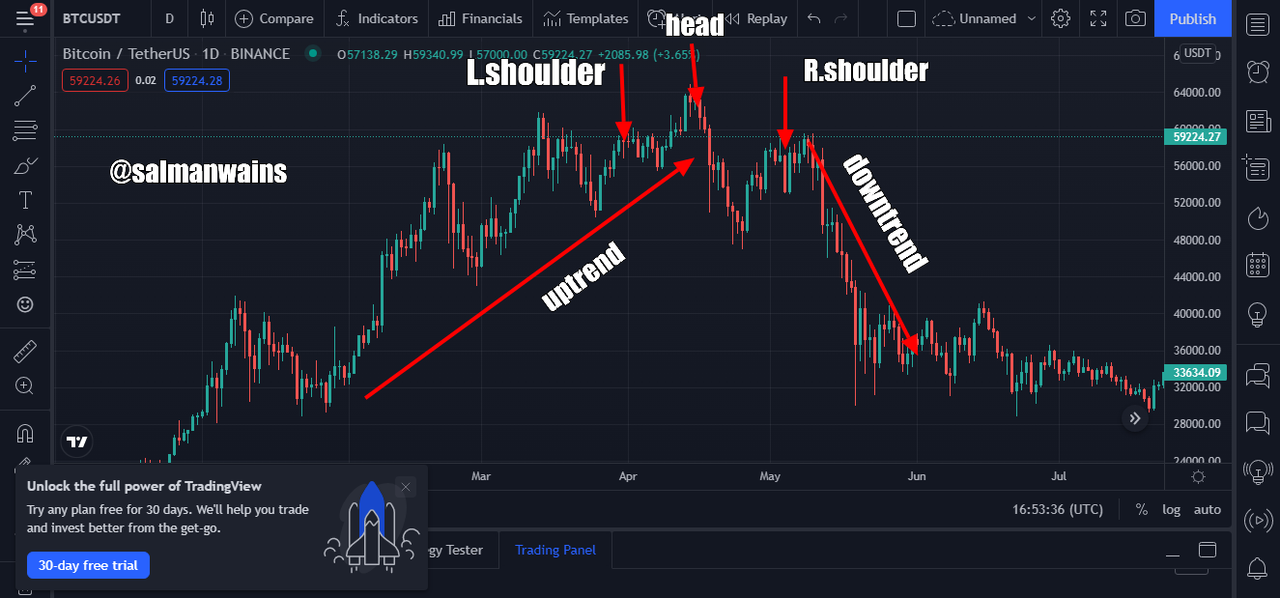
In the chart above we see a head and shoulder pattern. The left shoulder is formed when the price takes a sharp rise and then declines. The head forms when the price rises again.
The head is higher than the left shoulder finally the right shoulder is formed when price after forming the head declines and rise again. In most of the head and shoulder patterns we see that the right and left shoulder often have the same level. As shown in the BTC/USDT chart below.

Inverse Head and Shoulder Pattern
Much like the simple head and shoulder pattern the inverse head and shoulder pattern consists two shoulders and one head. This pattern is formed at the end of a bearish trend and therefore it is often referred to as the bearish to bullish reversal pattern.
The left shoulder in the inverse pattern is formed when the price takes a downtrend and then moves high the low that is obtained accounts for the left shoulder. The head is formed when the price rises again after a decline and is often lower than the left shoulder. The right shoulder is formed when the price once again falls to rise again.


Importance of volume in Head and Shoulder and Inverse Head and Shoulder patterns ?
The transaction volume often helps in determining the strength of the trend which means we can understand if the trend is actually supported by the off-market activity.
When volume raises in support of the trend it shows that the trend is strong and that the activity of the buyers and sellers are supporting the trend. Such trends have more possibility of continuation.
If we look at the volume changes during the head and shoulder pattern. We often see that the volume does not sufficiently reduce during the formation of the left shoulder but during the formation of the head a large number of buyers are exiting their selling positions and therefore we see a decrease in the volume while the trend is still bullish. The following concept can be indicated in the chart below.

The decrease in volume shows that the uptrend can be exhausted anytime soon as buyers are leaving their position and sellers are making their way into the market. The information of the volume thus helps us confirm the trend reversal. In similar ways as discussed above.
In reverse head & shoulder pattern the trading volume decreases as the price line makes a head although the trend is still bearish. This indicates a remarked decrease in the activity of sellers and thus a bullish reversal is expected.

Question# 2
What is the psychology of market in Head and Shoulder pattern and in Inverse Head and Shoulder pattern (Screenshot needed) ?
The head and shoulder pattern or the inverse head & shoulder pattern are both of indication of trend reversal and therefore, are formed at the end of an ongoing trend. In the chart we see before the formation of head and shoulder pattern the market was bullish. Now as the sellers begin to withdraw and the sellers enter the market the price volatility begin to decrease.
At the formation of the shoulder, we still see a significant buyer’s activity but as the price moves from there to move the head pattern there a lot of buyers have left and sellers have entered the market but still the buyers try to drag the market and the had is formed this give and take fight continue between the buyers and sellers and we continually see a rise and fall until the end of the second shoulder where the sellers completely take charge and we experience a downtrend. We can clearly see this cat and rat race in the chart below.
In the inverse shoulder patter before the formation of the pattern the market is following a bearish trend. Once the sellers start to leave their positions, we see the price rising as the buying bid increase.
Since the majority of the sellers still hold the position they drag the price back, at this point buyers have already started weakening and we see a decline in the bearish trend the price soars high and a head is formed. This continues until the second shoulder where buyers complete take control of the market and the market reverses to a bullish trend.

Question# 3
Explain 1 demo trade for Head and Shoulder and 1 demo trade for Inverse Head and shoulder pattern. Explain proper trading strategy in both patterns separately. Explain how you identified different levels in the trades in each pattern (Screenshot needed and you can use previous price charts in this question) ?
Trading Inverse Shoulder Pattern
- First of all, I identified an accurate inverse head and shoulder patter
- The market should previously be in a downtrend
- When the price made a sharp rise and made a shoulder and then dipped a little below to form the head and then reversed again to form the second shoulder it indicated a tussle between the buyers and sellers and predicted a reversal
- Wait for the price to break the neckline
- Wait until bullish candle is seen forming
- Set a take profit and stop loss limit
- Stop loss should be placed below the right shoulder
- The take profit should be placed equal to the distance between the low of the head and high of the shoulder

Demo Trade Setup for Head and Shoulder Pattern
- First of all, I identified an accurate head and shoulder pattern
- The market should previously be in a uptrend
- When the price made a sharp dip and made a shoulder and then rose a little below to form the head and then reversed again to form the second shoulder it indicated a tussle between the buyers and sellers and predicted a reversal
- Wait for the price to break the neckline
- Wait until bearish candle is seen forming
- Set a take profit and stop loss limit
- Stop loss should be placed above the right shoulder
- The take profit and stop loss can be in the ratio 1:2

Question# 4
Place 1 real trade for Head and Shoulder (at least $10) OR 1 trade for Inverse Head and Shoulder pattern (at least $10) in your verified exchange account ? Explain proper trading strategy and provide screenshots of price chart at the entry and at the end of trade also provide screenshot of trade details (Screenshot needed)?
For this part of the post, I will be trading LINK/USDT

Placing real trade using head and shoulder Pattern
- First of all, I identified an accurate head and shoulder pattern
- The market should previously be in a uptrend
- When the price made a sharp dip and made a shoulder and then rose a little below to form the head and then reversed again to form the second shoulder it indicated a tussle between the buyers and sellers and predicted a reversal
- Wait for the price to break the neckline
- Wait until bearish candle is seen forming
- Set a take profit and stop loss limit
- Stop loss should be placed above the right shoulder
- The take profit and stop loss can be in the ratio 1:2


Exiting the trade
As anticipated the market went bearish after the head and shoulder pattern the trade went well as the price reached the stop loss the I exit the trade.

Conclusion:
Head and shoulder patterns are reliable reversal patterns. It predicts a bearish reversal on the other hand, inverse head and shoulder patterns predicts bullish reversal pattern as we can see we applied the strategy for trading and it went well therefore, we can also use it in combination of other indicators for more accurate results.
CC:
@utsavsaxena
Club5050 Eligible

Hello dear Professor @utsavsaxena11,
It's been already more than 48 hours and my homework task isn't checked yet. And it seems like You have checked the homework of every other and maybe missed mined.
Please spare sometime and have a look at my homework task.
Thank You!