Crypto Academy Week 14 - Homework Post for Professor @fendit
This is Week 14 of Steemit Crypto Academy and I'm writing Homework Task for Professor @fendit
A)
Share your understanding of this lecture by answering the following questions
1)
What's the application of this theory?
Elliott Wave theory
Elliott wave theory was presented in 1938 by Ralph Nelson Elliott. It works on the principle that there are certain patterns that a market follows, and hence using these patterns, we can do price forecasting of any particular asset. This Theory is used by many expert traders to predict the future price.
So if we go by the definition of the Elliott Wave Theory, we can safely say that it is used for price prediction of any asset of our choice during a trading cycle. To do price predictions Elliott wave Theory helps with Two types of waves to predict future prices which are Impulsive waves and corrective waves. By using this theory, we can make better and well-informed decisions about the future price predictions of any asset which can help us make profits by entering and exiting the trade at the right time.
The Elliott wave theory shows us the uptrend and downtrend of any cryptocurrency which help us to decide when to buy and sell to get maximum profit. We need to check a cycle of 8 waves together. first 5 waves are impulsive waves and other 3 waves are corrective waves which can be found in the below BTC price chart in 2nd part.

2)
What are impulse and corrective waves? How can you easily spot the different waves?
Eliot Wave Theory principle identifies two types of waves that can be seen while analyzing the trade charts of any asset and these are,
- Impulse Waves
- Corrective Waves
Impulse Waves
These waves can be seen at the start of any new trend and follows the flow of the market. These Impulsive waves are represents as 1,2,3,4,5. The following chart demonstrates the impulse waves.
- Wave 1 occurs at the beginning of any trend. People buy at lower rates and the price of the asset goes up or down.
- Wave 2 occurs when people who bought at a low price start to sell at higher prices to make a profit or vice versa. This creates a wave in reverse order of the previous wave.
- Wave 3 starts with many more people starting to identify the trend and start to either buy heavily. This creates the 3rd wave which is also the longest trend in the wave cycle.
- Wave 4 takes place because traders start to sell again at a profit which creates a downward movement.
- Wave 5 is created due to the bullish traders who buy an overprice coin considering that it's price is low.
Corrective Waves
These corrective waves come after the 5 impulse waves and goes in the opposite trend. There are total of 3 corrective waves in Elliott Waves theory which marked as A, B, C and comes after 5 impulsive waves. There are a certain type of patterns that these waves follow which include,
The corrective waves labeled from A to c on the chart and we can see that waves A and C is in the direction of the main corrective trend but B doesn't.

The corrective waves are grouped as zigzag, triangle and flat.
- Zigzag
- Triangle
- Flat
Zigzag: In this formation, as we can see in the above chart, Wave B is little bit shorter than Wave A and C as well as price is going slightly Up. As the wave B is in opposite trend than A and C and the price is rising so the selling ratio of that particular asset become high and the market downtrend will start.
Triangle: It's really hard to spot this formation. These waves shows the downtrend of market . When we have this formation that means volume and volatility are decreasing.
Flat: In this formation, all the waves have same length unlike Zigzag and can spotted easily unlike Triangle .
3)
What are your thoughts on this theory? Why?
According to my perspective, the theory is a great tool to apply on price charts of the assets to access and predict the future price of the asset. I like this theory because the formulation and structure of the waves and the theory are data-driven. And quite frankly it works in the real world. The ability to apply Elliott Wave Theory on a chart and perceive the next happenings in the crypto trading world can be very helpful because it allows you to make decisions of what your next move will be. In my view, Elliott Wave Theory is a very effective theory and should be used more often in decision making.
Moreover, this Elliott Wave theory is been used by many traders from years to take profit. It's not that much difficult to understand the theory. We just need to know about the TWO waves which are impulsive waves and corrective waves and we can predict the price of any crypto asset. We don't need to go deep in the graphs to do more technical or other analysis. I have found this theory very much easy to understand.
B)
Choose a coin chart in which you were able to spot all impulse and correct waves and explain in detail what you see. Screenshots are required and make sure your name which cryptocurrency you're analyzing.
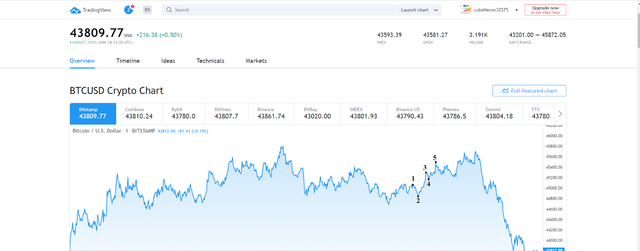
The chart that I chose for applying Elliott Wave Theory is Bitcoin(BTC). If you have a close look at the chart, you can easily identify the formation of impulse waves and corrective waves. The trend I identified starts from the wave labeled 1. It is the start of a bullish trend then we see a dip in the price as explained in the theory, Then the biggest rise as seen in the wav 3, and the trend follows the exact pattern as described by the principal.
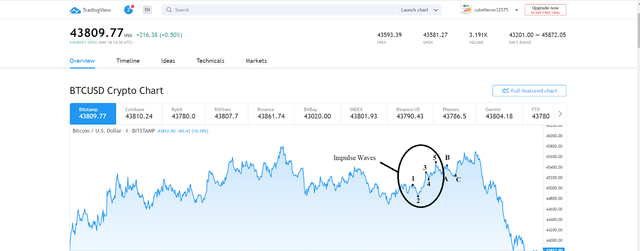
The first chart shows the creation of impulsive waves which are highlighted on the chart. These waves always occur at the start of a trend.
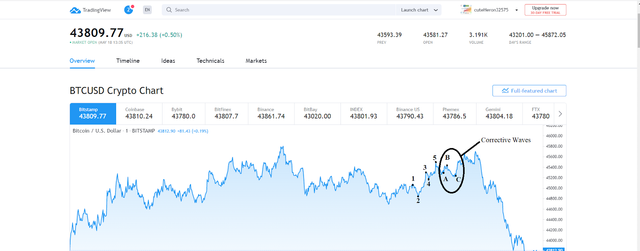
The Second chart shows the creation of corrective waves which are labeled as ABC on the chart. These waves always come after the impulsive waves.
I was able to identify the complete cycle of the Elliott Wave principle on the BTC price Chart. One complete cycle is highlighted in the above chart separately. A price chart can be consists of more than one such cycle.
Conclusion
I have completely understands the working of Elliott waves theory as well as about Impulsive waves and corrective waves and reached to the conclusion that this Elliott Wave theory help us in determining where to place our stop loss as well as the wave 3 must be the longest wave of the Three Impulsive waves. Moreover, wave 4 cannot reach the same price of wave 1. And if anything happens like that, it means we are not identifying the waves properly. And if we do everything right then we can do get profits by predicting the Future trend.
I hope that everyone who read will like my attempt of answering this week Homework task.
Thank You!
Shared on Twitter
Thank you for being part of my lecture and completing the task!
My comments:
Nicely done! Your explanations on the first task were really good!
Still, I wish you had analyzed a bit more the second one. You really did identify the pattern correctly, but explanation was a bit too brief.
Overall score:
6/10