Crypto Academy Season 3 Week 7 Homework Post for Preofessor @kouba01| Trading Crypto With Average Directional Index (ADX) Indicator by @salma78

Question 1
Discuss your understanding of the ADX indicator and how it is calculated? Give an example of a calculation. (Screenshot required)
The Average Directional Movement Index (ADX) indicator also known as the Average Directional index is used in determining false signals in the price movements of crypto assets. The Average Directional Movement Index indicator was created by J. Wells Wilder Jn. It was first used in 1978 till date. It is mostly not used often as compared to the other indicators. The ADX Indicator when used with other indicators provides accurate results in trades than when it is used lonely. The strength of a trend in a chart is determined by the ADX indicator. This indicator doesn't involve the prediction of buy signals or sell signals as in the case of the other indicators. The ADX indicator determines the strength of an asset's trend whether in the upward direction (uptrend) or in a downward direction (downtrend).
How to determine the trend in an ADX indicator
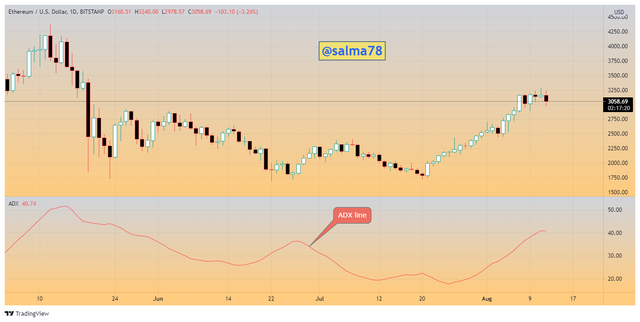
The ADX indicator comprises a major line known as the ADX line which has values ranging from 0 to 100. The strength of the trend of an asset is usually determined by these values that range from 0 - 100. This ADX line is what helps in the determination of the strength of the trend of an asset. I would tabulate the values ranges and their trend strength each represents below here in this article.
| ADX Value | Strenght of Trend |
|---|---|
| Between 0 to 25 | No or very weak trend |
| Between 25 to 50 | Strong Trend |
| Between 50 to 75 | very Strong Trend |
| Between 75 to 100 | Extremely Strong Trend |
Interpretation of the table above
First of all, when the value of the ADX line falls between 0-25 then we get to know that there is no trend available or an indication of a weak trend.
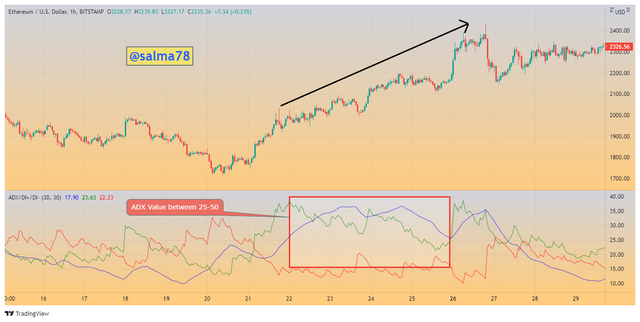
Secondly, when the value of the ADX line falls between 25-50 then there is an indication of a strong trend. The strong trend is mostly determined between values above 35-40.
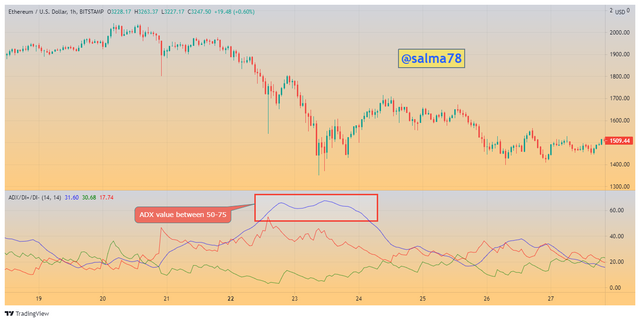
Thirdly, when the value of the ADX line falls between 50-75 then there is an indication of a very strong trend.
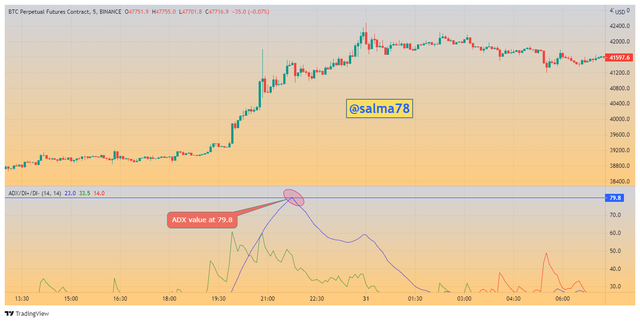
Lastly, when the value of the ADX line falls between 75-100 then an indication of an extremely strong trend. This trend value is not usually seen as in the case of the others.
The concept of the ADX Indicator and the DMI Curves
The ADX indicator is aided by the DMI curves in the reading of charts of crypto assets. It is the DMI Curves that make it very easy in analyzing charts of assets. These DMI curves are what determines the trend direction of an asset when using the ADX indicator. There are two minor lines known as the DI+ line and the DI- line and also a major line termed as the ADX line. These three lines form the major components of the ADX indicator but the two minor lines are the types of lines of DMI Curves. The default color of these lines on my chart is represented in the table below but it should be noted that these colors can be altered.
| ADX Indicator Line | Color |
|---|---|
| ADX line | Blue |
| DI+ | Green |
| DI- | Red |
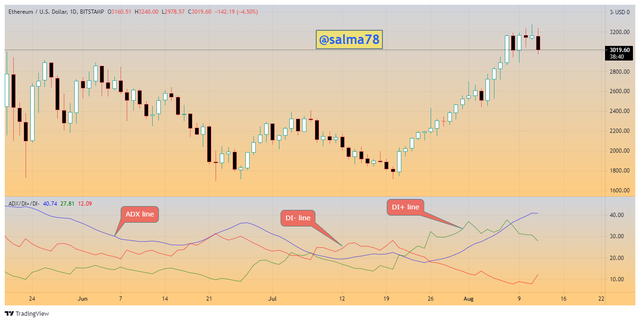
The DMI curves have a DI+ line and DI- line with each representing different strength of a trend. The DI+ line indicates the strength of an uptrend whilst the DI- line indicates the strength of a downtrend. Furthermore when the DI+ line moves above the DI- line then there is an indication of the price of the asset rising. Similarly, when the DI- line is moving above the DI+ line, then there is an indication of the price of the asset declining or falling. These two lines are very sensitive and shouldn't be considered when taking a buy or sell trade.
In calculating the ADX Indicator the following procedures should be kept in place;
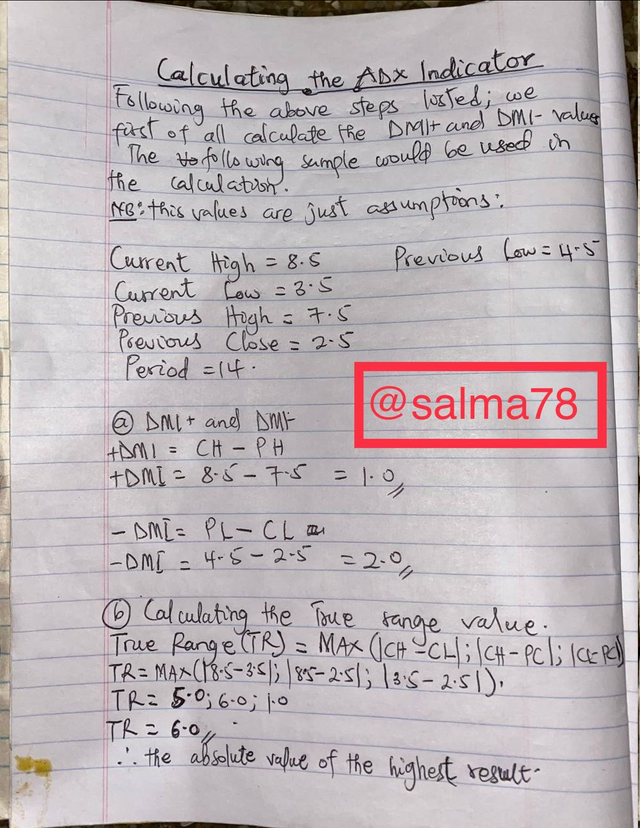
- First Calculate the DMI+ and DMI- values using the following formula;
+DMI = Current High (CH) - Previous High (PH)
-DMI = Previous Low (PL) - Current Low (CL)
- Then we calculate the Range using the following formula;
Current High (CH) - Current Low (CL)
Current High (CH) - Previous Close (PC)
Current Low (CL) - Previous Close (PC)
Formula; Range (TR) = MAX (|CH - CL|; |CH - PC|; |CL-PC|)
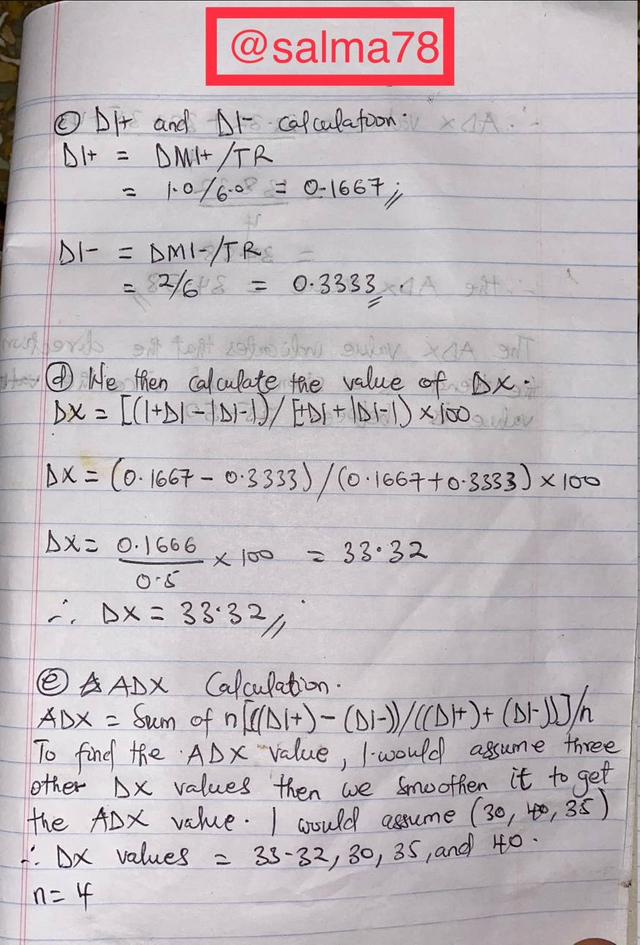
+We then calculate the DI+ and DI- values using the formula below;
DI+ = DMI+/TR
DI- = DMI-/TR
We then calculate the value for DX using the formula below;
DX = [(|+DI - |DI-|)/[(|+DI+|DI-|)×100
Note: n times of DX should be calculated then the results smoothen to determine the ADX value.
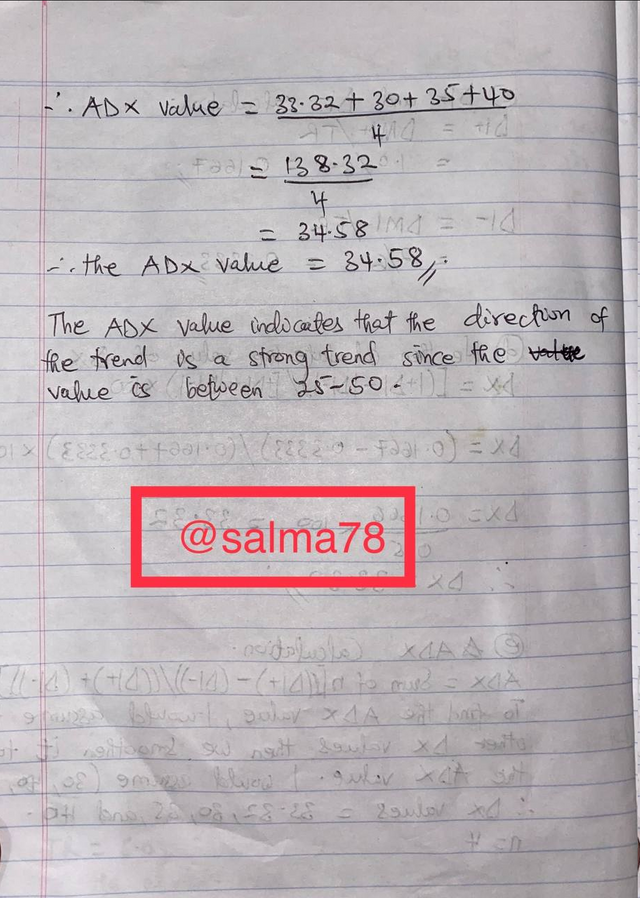
- After obtaining our DX value we then use the following formula to find the ADX value.
ADX = Sum of n [((DI +) - (DI-)) / ((DI +) + (DI-))] / n

Question 2
How to add ADX, DI+, and DI- indicators to the chart, what are its best settings? And why? (Screenshot required)
I would be demonstrating this using the tradingview platform.
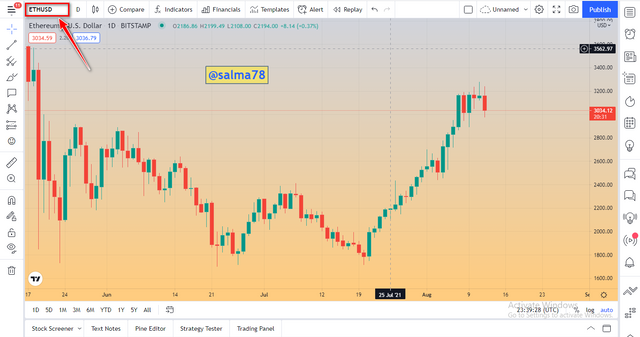
First of all we visit the tradingview website TradinView.com.
Select a pair of assets i.e. I would be using ETHUSD pair.
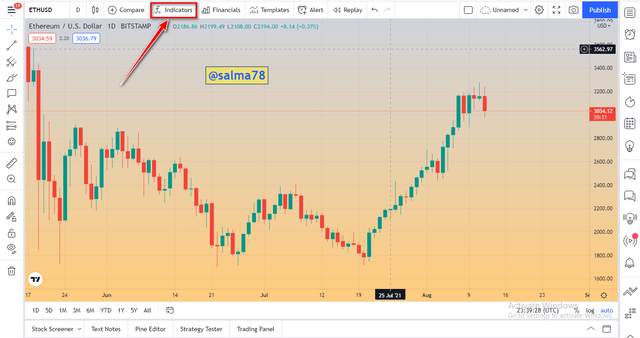
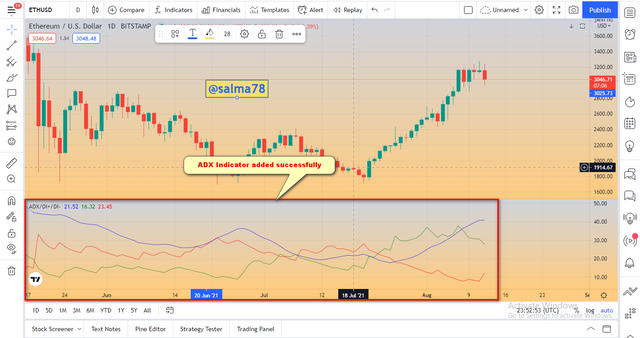
- Click on Indicators & Strategies Icon from the toolbar.
- Search the Average Directional Index and then select the ADX with DI+ and DI- included.
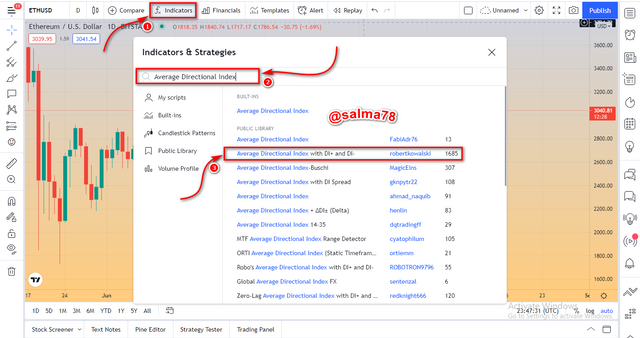
- Now the ADX indicator is added successfully.
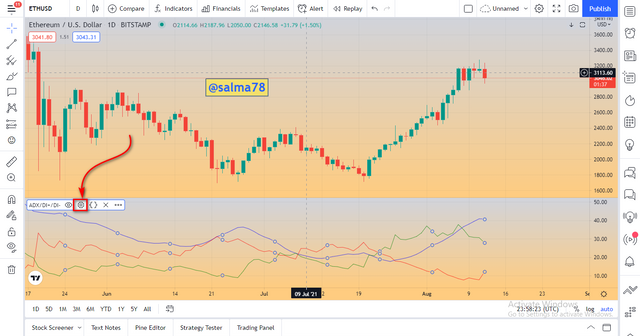
Configuring the Average Directional Index
- First of all, click on the Indicator line and then click on the Settings icon of the Indicator.
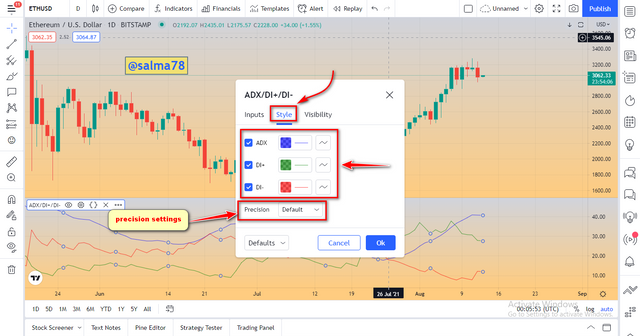
- The style settings appear:- This setting includes colors of the ADX line, DI+ line, and the DI- line. It also includes the precision parameter. I will maintain the default settings indicated below.
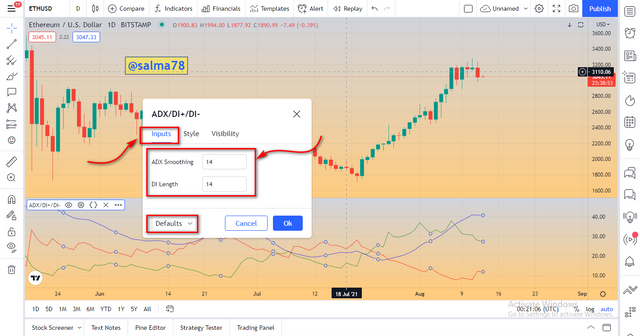
- Inputs Settings:- This setting includes ADX smoothing and DI length. The default parameter settings for these are 14 for both. This indicates that the DI length 14 means that readings would be taken from the last 14 candles by the ADX indicator. This explains that if the DI length is altered to any parameter, the readings would be taken from the value of that parameter by the ADX indicator.
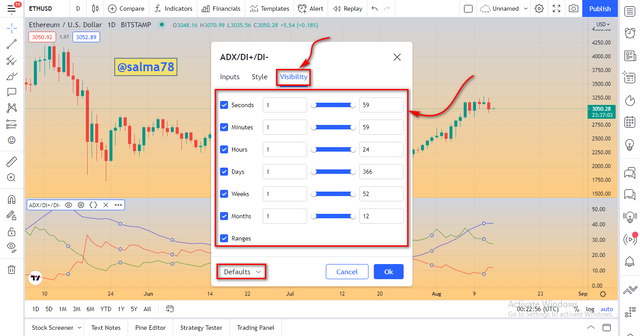
- Visibility Settings:- This setting includes seconds, minutes, hours, days, weeks, months, and ranges of the indicator. The default settings for these would be maintained as seen from the screenshot below.
The Best Settings for the ADX Indicator and why it is the Best.
The best settings for the ADX indicator to me would say it is a general option or choice of the trader because of every trader and the style of trading. But we know the standard settings of the ADX indicator to be 14 periods. This is because short periods usually generate so many signals which can lead to the generation of too many false signals as well. But in the case where a longer period is used, the reaction with the price movements does not often occur and that is why 14 periods were selected as the default and standard settings. I would illustrate good examples here on a chart to indicate some differences.
- For a 14-Period ADX Indicator
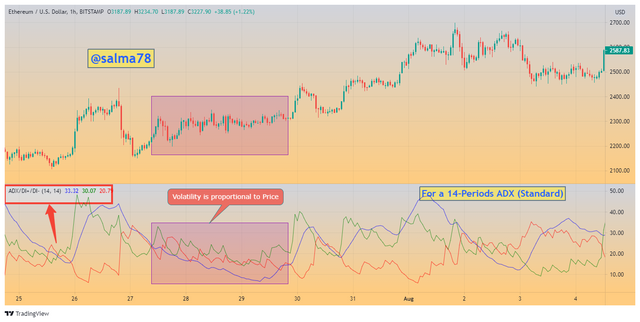
From the above chart, we can clearly see that the ADX indicator was moving accurately with the price action. This is when the 14-period ADX indicator (Standard) was used.
For a 7-Period ADX indicator
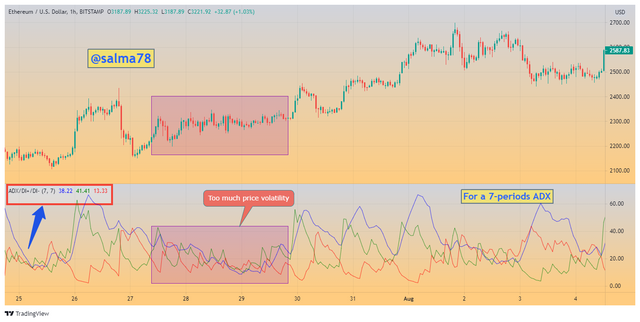
From the above chart, we can clearly see that there is too much price volatility. This is because the ADX indicator would quickly respond to any small change in the price of the asset which tends to provide great volatility of price as a result of the change in price value frequently. In this situation, we see that the lines are too close to each other which makes reading difficult.
For a 30-Periods ADX indicator
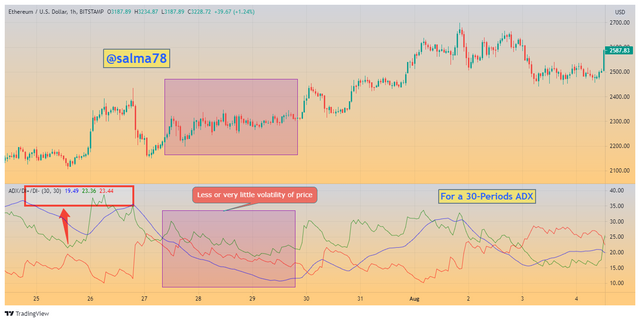
- From the above chart, we can see clearly that there is less volatility of the price. This is because of the less frequent signals provided by the indicator. In this case, the lines are widely apart from each other which makes the chart very easy to read.
As I already mentioned earlier that the settings of the ADX indicator being the best would depend on the kind of trading style one is using. The time period in which a trader would be working should be adjusted to suit the trader. A scalping trader for instance is supposed to use periods between 7 to 9 in order to make an accurate analysis. Longer periods such as the 30-Periods are a good option for swing traders. When these periods are set with respect to the trading style then an experiment should be followed back in order to achieve the right settings for your own purpose.
The 7 and 35-period values should not be surpassed when using the ADX indicator. This is a recommendation and should be abided with. The ADX indicator should be used with the aid of other indicators like the MACD indicator and RSI indicators in order to give accurate results. This all indicates that saying a certain period's settings is the best among the others would not be the right way but instead, the best settings would be the choice of the trader, his trading style, and also his trading experience to add different indicators to the ADX indicator to achieve accurate and perfect results but it should be noted that no indicator ever gives a 100% accurate results.
Question 3
Do you need to add DI+ and DI- indicators to be able to trade with ADX? How can we take advantage of this indicator? (Screenshot required)
The ADX indicator purposely functions in determining the availability of a trend and also the strength of the trend as well. As I stated earlier, the ADX doesn't help in determining buy and sell signals or the direction of trends of assets but rather the strength of the trend. When the DI+ and the DI- are being added to the ADX indicator, then it can serve the purpose of determining the trend direction of an asset. Although adding the DI+ and DI- is possible and aids in the determination of trends direction but it is recommended to use different indicators to support the ADX indicator so as to provide accurate results.
Furthermore, without adding the DI+ and DI- indicators do not deny trading but rather a trader can trade with the ADX indicator with other indicators supporting it. I would illustrate this on a chart as an example below.
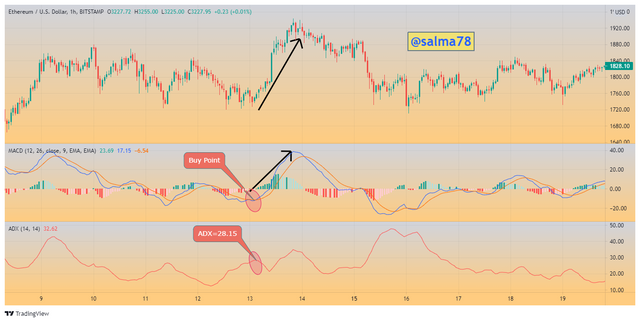
From the 1-hour ETHUSD Chart shown above, we can clearly see that a buying point was set without the aid of the DI+ and DI- indicator.
The ADX line was having a value of 28.15 which indicates a strong trend. Using the MACD indicator to support the ADX, we saw that the MACD line crosses over the signal line which indicates an uptrend thereby creating a buy signal. The price action of the asset gave an uptrend after the buy point created on the chart. This shows how the MACD indicator can be used in determining the buy and sell signals of an asset's price.
Although the DI+ and DI- indicators do not help in determining the strength of trends but rather they also play a vital role when it comes to the identification of trends direction. It is the DI+ and the DI- indicators that help traders in identifying the direction of trends of assets. This is because of how fast it reacts with the price action of an asset. The price rising of an asset is indicated by the DI+ line whilst the price falling of the asset is indicated by the DI- line.
Now let's add the DI+ and DI- to the same chart above to indicate the trend direction of the ETHUSD asset.
- Bullish Trend
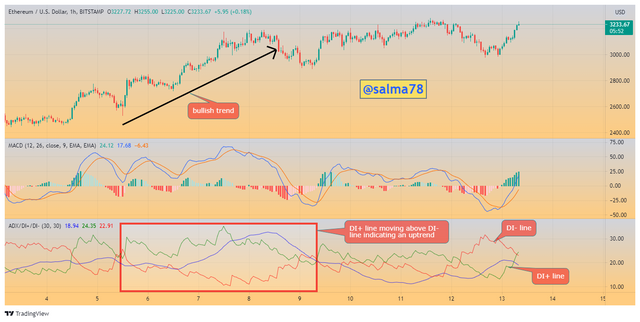
- From the above chart, we see that when the DI+ line started moving above the DI- line, an indication of a bullish trend started and it continuously moved in that direction until the DI+ line cuts across below the DI- line.
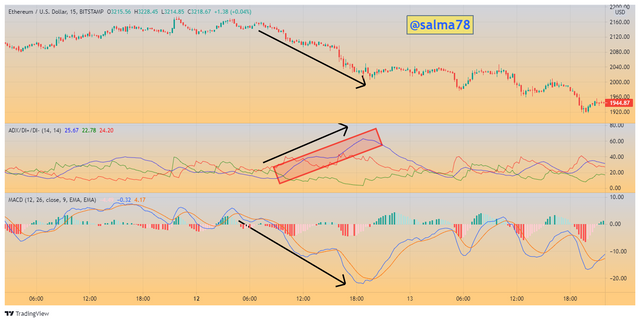
- Bearish Trend
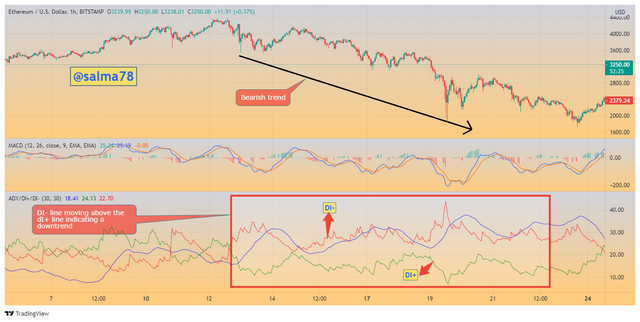
- From the above chart, we see clearly that when the DI- line started moving above the DI+ line, an indication of a bearish trend started and it continuously moved in that direction for a long period. This period indicates a high bearish trend in the market. It was noted that at the time where the DI- line crossed over the DI+ line the ADX value was 25.22 which indicates a strong trend. This explains why the bearish trend in the market was really high during that period.
It should be noted that some trading analysts do consider DI+ and DI- indicators to give buy or sell signals at areas when the ADX line value is above 25. This analysis is not taken because the DI+ and DI- indicators only support the ADX indicator as an advantage but not in determining trade entry and exit points. This DI+ and DI- indicator when used with the ADX indicator help in identifying the trend direction of an asset and when the space between the DI+ line and the DI- line increases, then the strength of the trend also tends to increase.
Question 4
What are the different trends detected using the ADX? And how do you filter out the false signals? (Screenshot required)
As indicated earlier, the trends detected by the ADX indicator are given in the table below and I would explain each using crypto charts.
| ADX Value | Trend |
|---|---|
| 0-25 | No or very weak trend |
| 25-50 | Strong trend |
| 50-75 | Very strong trend |
| 75-100 | Extremely strong trend |
- No or Very Weak Trend:-
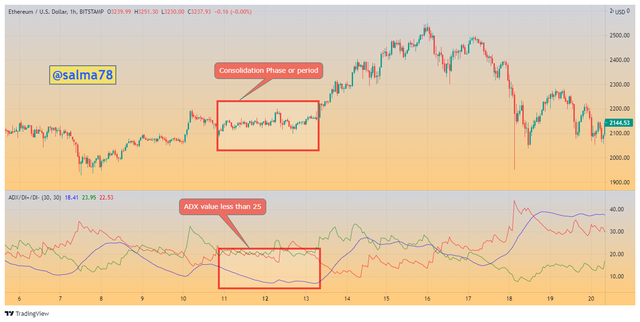
When the ADX value is less than 25 then a very weak or no trend is indicated. When this happens we say that the price of the asset is at the consolidation phase. This means that the asset's price is stationary without any upward or downward movement. This can be illustrated from the chart below.
From the chart shown below, we can notice that the ADX value is below 25 and this indicates a very weak or no trend in the price of the ETHUSD.
- Strong Trend:-
When the ADX value is between 25-50 then a strong trend is indicated. When this happens traders take advantage of this period and take their trades because the ADX value 25 indicates the start of a trend of an asset. This can be illustrated from the chart below.
From the chart below we can notice that there is an uptrend as this is as a result of the DI+ line crossing over and moving above the DI- line as shown below.
- Very Strong Trend:-
Similarly, when the ADX value is between 50-75 then a very strong trend is indicated. These ADX values indicate a high volume of buying trades by investors which tend to break the support/resistance levels of these values. This can be illustrated from the chart below.
- Extremely Strong Trend:-
Similarly, when the ADX value is between 75-100 then an extremely strong trend is indicated. There is high volatility in the market during this period. This period doesn't take a long time and it's mostly followed by a reversal trend. With respect to the extremely strong trend, it is very uncommon to see such occurrences on a crypto chart.
Filtering of false signals can be done in so many different ways with the use of the ADX indicator. One of these ways includes the transition to longer periods with the ADX indicator. Not every time that when the ADX line forms lower highs indicate a trend change but instead it can mean a weak in strength if the trend. This indicates that only the strength of the trend would decrease when there exists an ADX line that is above the 25 level mark. Another way of indicating or filtering false signals is the use of other indicators such as RSI, MACD, etc.
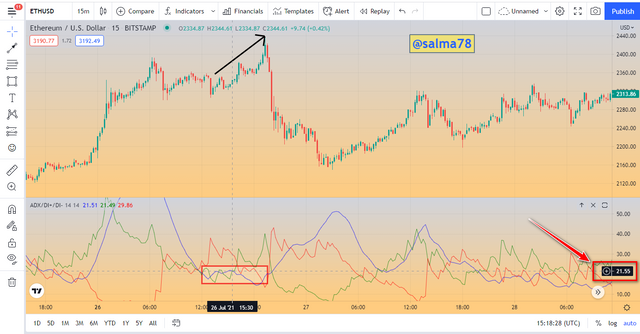
- From the chart below, we can see that the ADX line is moving between the 0-25 values which should under normal circumstances give no trend or a weak trend. But with respect to this, the ETHUSD chart indicates an ADX line moving below 25 levels but the price trend is moving upward (showing a strong trend) as indicated in the chart below.
- Also, another false signal is generated when the ADX line is moving above the 25 levels but we tend to see the trend of the asset weakening and falling. Under normal circumstances, the ADX line, when moving above the 25 marks indicates a strong trend in its movement but here is the case where the trend tends to weaken or fall whiles the ADX is above the 25 mark. I would illustrate this in the chart below.
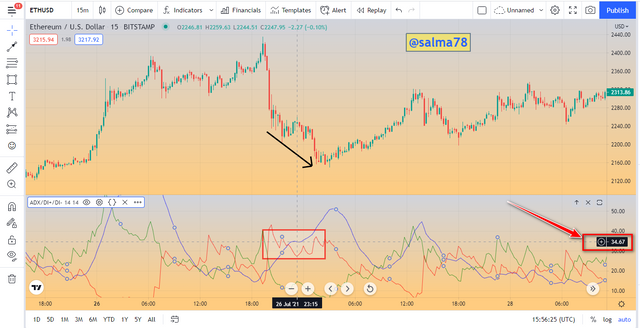
- Another situation is seen in the trend reversal of the price of an asset. In this case, the price of the asset tends to reverse downwards but the ADX line is indicating an increase in the strength of the trend. This signal indicated by the ADX line is a false signal and this is why it is advisable to use indicators in addition to the ADX indicator to analyze the trend of assets.
We can also see from the chart that when the MACD indicator was added to the chart, the MACD line crossed below the signal line which indicates a downtrend just as the price trend movement but the ADX line gave a false signal.
Question 5
Explain what a breakout is. And How do you use the ADX filter to determine a valid breakout? (Screenshot required)
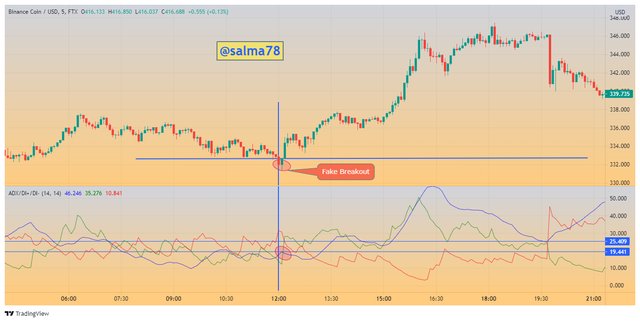
Breakout in cryptocurrency refers to the point or level at which an asset's price exceeds the support level or the resistance level. This occurs as a result of the overbought or oversold of the asset at that point or level (resistance or support). It should be noted that these breakouts are sometimes created by the big financial institutional investors to lure traders thereby leading to fake breakouts in the market. When a fake breakout occurs we see the price of the asset moving in the opposite direction of the fakeout but under normal circumstances, it is supposed to move in the same direction as that of the breakout. Let's consider the following two charts and illustrate these two differences (Fake Breakout & Real Breakout).
The ADX indicator as mentioned earlier is used in determining the strength of a trend and thus we can use this trend strength determination to indicate and filter out fake and real breakouts.
How to do Filtering with the ADX Indicator.
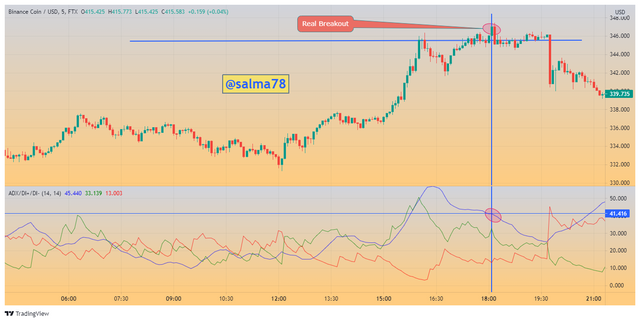
Trends are usually considered to be active when the ADX line is above the 25 mark, thus when a breakout occurs at regions below the 25 level of the ADX then this is not considered as a breakout but on the other hand, when the breakout occurs in regions above the 25 level of the ADX line then we consider that as a real breakout.
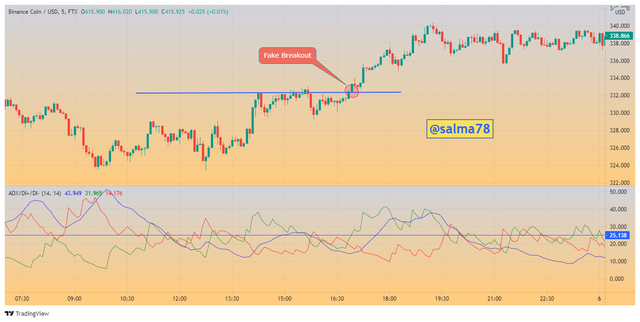
- Filtering Fake Breakout:- From the BNBUSD Chart shown below we can clearly see that the breakout occurred in a region where the ADX line is at a value of 19.441. These areas are considered to be a no-trend strength and thus this is a fake breakout and it is not considered.
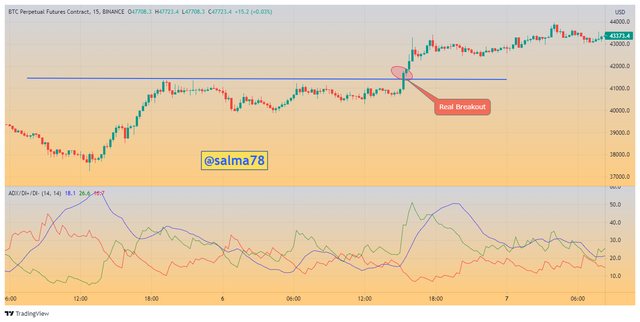
- Filtering Real Breakout:- From the BNBUSD Chart shown below we can clearly see that the breakout occurred in a region where the ADX line is at a value of 41.416 and we know these areas are considered to be a strong-trend strength and thus this is a real breakout and it is therefore considered.
Question 6
What is the difference between using the ADX indicator for scalping and for swing trading? What do you prefer between them? And why?
Scalping trading refers to a type of trading method in which traders use to make more profits with just a small profit earned. This method allows traders to enter into a trade-in more than one position within a day trade. The time frames of 1 minute, 5 minutes, and 15 minutes are usually used in this method.
In using the ADX indicator for scalping trading, shorter periods are mostly used instead of the standard period (14-period). But it should be mindful that the creation of false signals would increase as a result of the shorter periods being used. But one can filter these false signals by the use of additional indicators such as the Ichimoku cloud, the Average True Range indicator, and also RSI indicator. Now let's look at Swing trading.
Swing Trading is also a type of trading method that allows traders to maintain their positions for a number of days due to fluctuations in the price of an asset. This method uses medium time frames such as 1 hour, 2 hours, 3 hours, and 4 hours.
In using the ADX indicator for swing trading longer periods are usually used rather than the standard period (14-period). These periods must be adjusted with the trading timeframe so as to avoid delaying in producing the signals. Unlike in the case of scalping trading where more than two indicators are required, in this method not more than two indicators are needed to take care of any false signals. Indicators like the Ichimoku and the pivot point indicator are mostly recommended in this trading method. The Ichimoku indicator can be utilized in determining trade entry and exit points. Unlike in the case of scalping trading where too many unreliable signals are generated, with swing trading, the signals are reliable but slowly generated.
I would prefer the swing trading method to the scalping trading method and this is because of the reliable signal it produces with the ADX indicator. Also, I would go in for the swing trading method because it does not give too many false signals as compared to that of the scalping trading method. Again, the swing trading method produces clear and visible entry and exit points on charts due to the larger periods used. Furthermore, the fewer indicators involved in the swing trading method would make my trading charts look less crowdy and as a result, clearer indications can be detected easily. Using the swing trading style would also create a chance for one to relax and come back to trade especially during high fluctuations in the market. With all these reasons enumerated, I would prefer to use the Swing trading style with the ADX indicator rather than the Scalping trading style.
To conclude, I would like to summarize what we have discussed so far in this article. First of all, we looked at the concept of the ADX indicator and how it is being calculated by using an example to illustrate its calculation. We also discussed some of the uses of the ADX indicator and then further looked at the procedures taken to add ADX, DI+, and DI- indicators to a chart. We also discussed the best settings for this indicator with charts and explained why those settings were considered the best.
In addition, we discussed the reasons why the DI+, and the DI- are necessary to be added on a chart in order to successfully trade with the ADX indicator. We looked at some of the advantages of this indicator by using crypto charts as examples to explain. We further looked at the kinds of trends detected using the ADX indicator and how to use the ADX indicator to filter out false signals.
We also looked at the concept of breakout in cryptocurrency and how to use the ADX indicator as a filter to indicate valid breakouts on crypto charts. Lastly, we discussed the differences between the use of the ADX indicator for both scalping and swing trading methods and also explained my reasons for choosing the swing trading style as my favorite.
I would like to say thank you to professor @kouba01 for such a wonderful lecture taught this week and I look forward to participating in your subsequent homework tasks.
Thank You.
Hello @salma78,
Thank you for participating in the 7th Week Crypto Course in its third season and for your efforts to complete the suggested tasks, you deserve a 10/10 rating, according to the following scale:
My review :
Very excellent work which covered the subject in all its aspects in a superb manner and with a solid methodology. Most of the answers were precise and direct, which confirms your good understanding of the questions asked.
Thanks again for your effort, and we look forward to reading your next work.
Sincerely,@kouba01
Thank you so much professor @kouba01 for such a kind remarks. I am very honored to have participated in your lecture. I look forward to attending your subsequent lessons and I wish for you convenience in your work.
Thank you.🤗