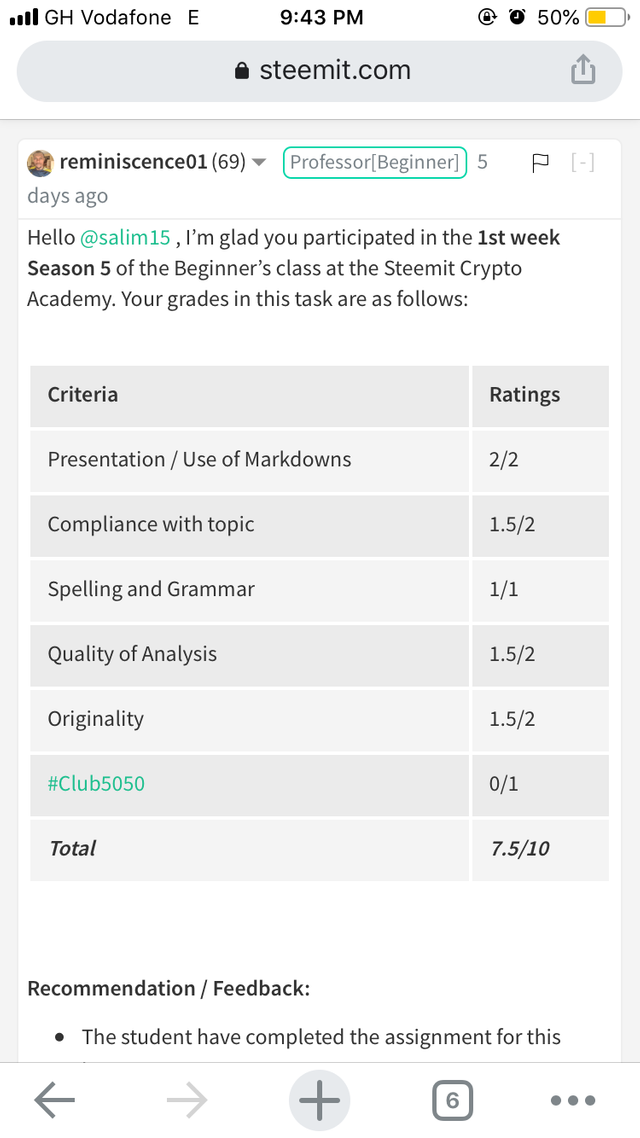
Repost - Crypto Academy / S5W1- Understanding Trends-Homework Post for @reminiscence01
Hello Everyone...!!
It is another great season in the Steemit Crypto Academy Season 5. Verily the season has started with a good lecture by Professor @reminiscence01 on the topic Understanding Trends. It is an interesting topic as far as cryptocurrency is concern and hope to tackle the homework task to the best of my understanding.

1) a) What do you understand by a Trending market?
To start with, trend can be explain as a direction at which a certain subject matter generally developing towards or a direction at with something keep changing towards. So in relating this in the crypto market, prices of crypto assets changes all time.
This changes is as a result of some factors and this is checked using charts to locate or identify the direction of the assets prices in the crypto market.
This serves as paths to enable an investor or trader to know the current state of the crypto market and will be able to predict or determine the future of the assets prices based on the market trend. This will enable a trader to know whether the market is rising or declining and also the momentum at which it changes. So from the crypto perspective, the trend in then taken place when the price of a certain crypto asset changes either positively or vice versa within some defined period in the market.
Ideally in the crypto market, the price trend of crypto asset is most cases observed the trend of the successful BITCOIN asset. The changes in the trend of a bitcoin is one of the major factor that affects the changing trends of other crypto assets.
So most of investors in the crypto market uses the analysis of Bitcoin to observe other crypto assets empirically before making their investment and other transactions.
The understanding of trend can be verifiable explain in the marketing from practical observation in three different ways. This are characteristics that will enable you understand the current trend of an asset in the crypto market and these are; an uptrend, downtrend and a sideways trend.
All this trends occurs in the crypto market at some point in the market. So the understanding of these particular topic will enable you to identify the instance of the market and this will enable you to trade well in the market.
b) What is a bullish and a bearish trend? (screenshot required)
Trend in the crypto market can be seen in this two perspective. Assets prices can be observe to be in a continuous rising or declining within some period of time. This two terminologies then try to explain the concepts respectively.
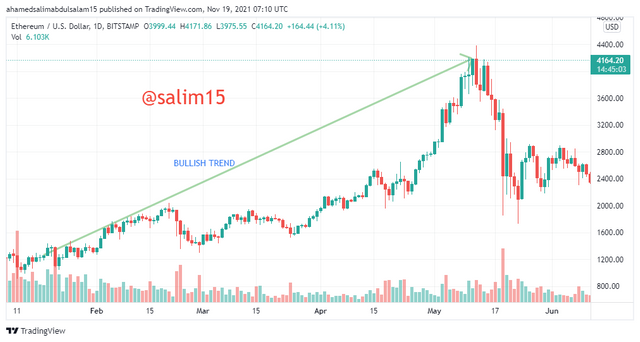
- BULLISH TREND
A bullish trend refers to an absolute increase or rise in assets prices in the crypto market. Within this time period, there is a generally increase of price and when this happens, investors turn to purchase more of the crypto assets.
The idea of the crypto trader is that the risk with regard to such asset is low because the demand for the crypto asset in the market increases. The higher the demand of such asset the higher the continual increase in the price.
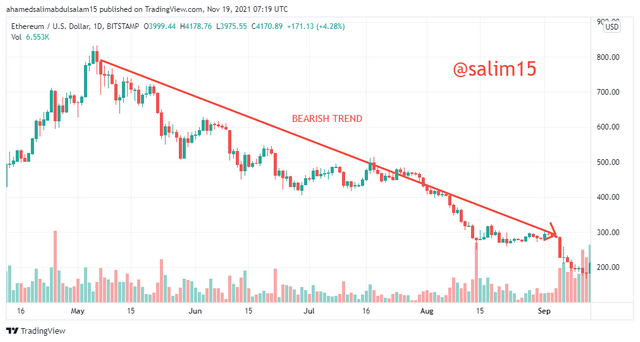
- BEARISH TREND
A bearish trend has an inverse explanation to that of bullish trend therefore a bearish trend refer to the general declining of the price of crypto asset occurring inside the bounds of the imaginary limits.
This period in the crypto market will undergo economic contraction and which is not a good option for a trader. However this period is attributed with a high risk in crypto investment and does not literally favors cryptocurrency holders and hence it scare away investors since lost is not a privilege option for crypto investor.
2) Explain the following trend identification and give an example of each of them. (Original screenshot needed from your chart). Do this for a bullish and a bearish trend.
i) Market Structure.
Market structure is a whole concept that gives a general overview of the current state of the crypto market. The market structure is clearly explain using charts that enable to provide confidential truth that whether the current market is either rising or declining or between the two thus a ranging phase.
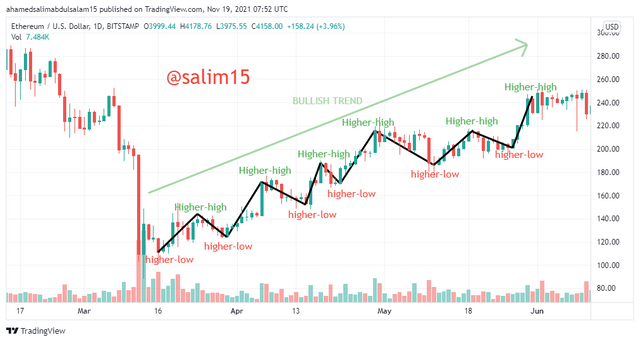
- BULLISH TREND
When the market structure over the bullish trend is empirically observed, we can see the candlesticks moving in a pattern of higher-highs and higher lows. This forms a continuous price movement in the market. The trend pattern is observed that, the price trading will not go below the previous low and same way it will not closed above the previous high.
So looking at the chart, it increases gradually in a pattern which creates an entry point for investors to come in thus, at every rise in the trend traders earns profits by exiting the market also at every decline there is a buying possibility and all this serve as trading opportunities in the market.
- BEARISH TREND
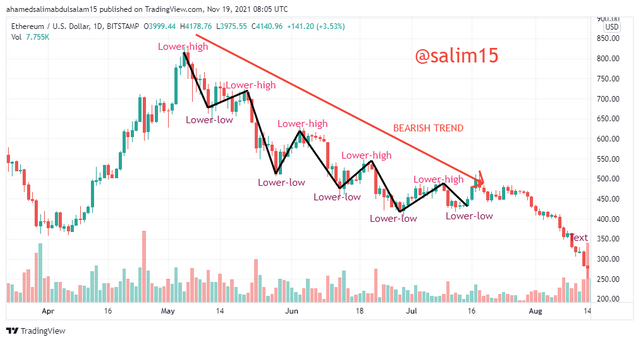
When the market structure over the bearish trend is verifiable observed, we will obtain a lower-highs and a lower-lows formation. It is however observed that the price mechanism there is declining gradually in the chart graph.
This can further be explain that, the trading price will not close above the previous high and the market is experiencing a continuous decline. This representation gives a clue that at every downtrend gives a possibility for traders to purchase while every uptrend gives a selling off possibility and this market situation grants trading opportunities in the market.
ii) Trendlines
The Trend Line is similar to that of the market structure in a sense that, it identify the market direction using the candlestick charts. This refers to a line in the candlestick chart that is drawn on purposively to connect to the relevant high or low points.
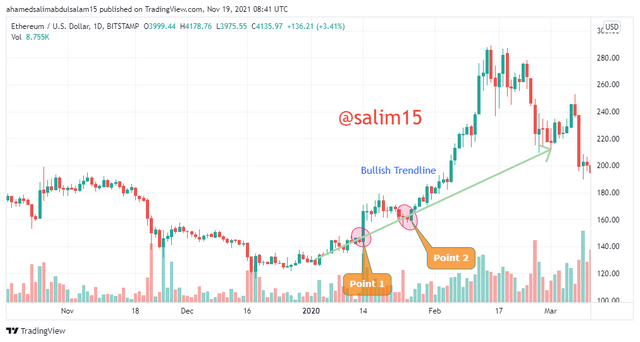
From this we can made a statement that with regards to an uptrend, two low points merge together with a straight line extension. In the other way round, a downtrend merges two high points with an extension line drawn
through the points.
For asset price that is undergoing an uptrend and the trend line is drawn through the important low points, the candlestick always hit the bullish trendline as a results of price retracement.
This phenomenon is what is been practice in the market by traders who are into the trading of crypto assets thus buying and selling in the market in order to obtain the required profit.
So this can be justify that, until the candlestick is broken through the bullish trendline the price will always hit the trendline and rise again. The bullish trendline analysis is violated when the candlestick broke through the trendline.
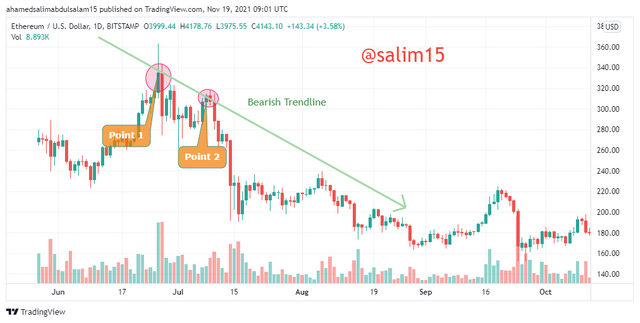
For asset price that is undergoing a downtrend and the trend line is drawn through the important high points, the bearish trendline serves as a resistance for candlestick to hit and fall back as a result of price retracement. This can be said that, every new resistance is an exit point while every new support in an entry point.
However, until the candlestick is broken through the bearish trendline the price will always hit the trendline and fall back. The bearish trendline analysis is violated when the candlestick broke through the trendline.
3) Explain trend continuation and how to spot them using market structure and trendlines. (Screenshot needed). Do this for both bullish and bearish trends.
To start with, a market is said to trend in which assets prices fluctuates and turns to come in contact with the trend line or touches the trend line. The fluctuation causes the continual rise and fall of the prices of commodities.
The situation experience several variety of traders thus some investors do exit from their positions after making their profits when the price is high and this give others opportunity to occupy the new positions when the price decline. This phenomenon guarantee the market trend of assets. I will however elaborate it on bullish and bearish trends.
BULLISH TREND
For bullish trend, two important points need to be noted when trend keeps on rising and thus;
• The new low point must be higher than that of the previous low
• The new high point must be higher than that of the previous high
BEARISH TREND
For bearish trend, two important points need to be noted when trend declines and thus;
• New low mush be lower than that of the previous low
• New high must be lower than that of the previous high
MARKET STRUCTURE
- BULLISH TREND
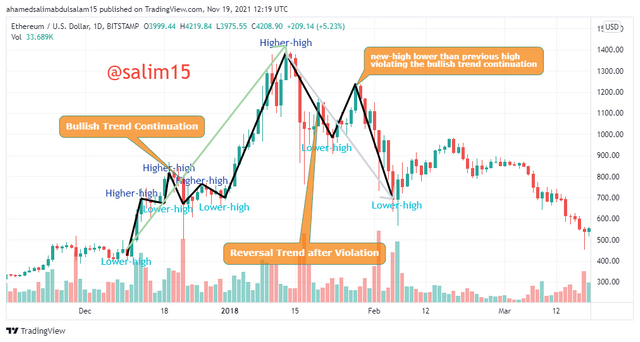
For a bullish trend continuation, the resistances are continuously tested and broken forming new resistance which is higher than the previous resistance making the candlestick to move in a pattern of higher-highs and higher-lows.
This trend patterns continuous until the previous high is higher than the new high, this however weaken the bullish trend continuation pattern and the trend may move in opposite direction.
- BEARISH TREND
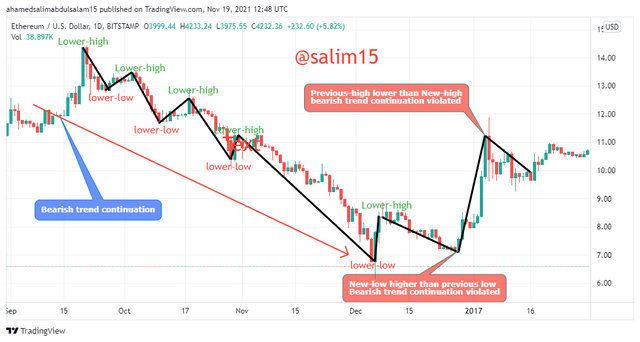
For a bearish trend continuation, the support are continuously tested and broken forming new support which is lower than the previous support making the candlestick to move in a pattern of Lower-lows and Lower-highs.
This trend patterns continuous until the new low is lower than that of the previous low, this however weaken the bearish trend continuation pattern and the trend may move in opposite direction.
TRENDLINES
• BULLISH TREND
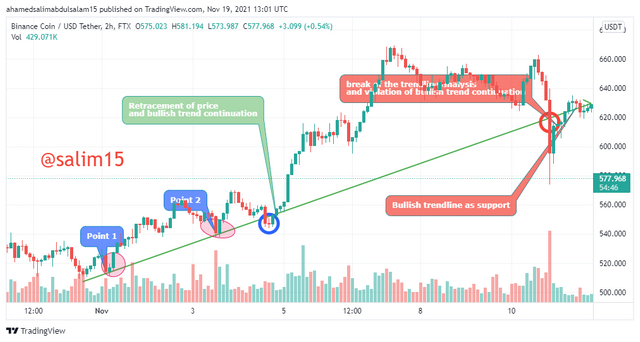
For a bullish trendlines continuation, two lower points are identified and straight line is drawn through the individual points, the bullish trendline serves as a support of which the candlestick hit and projects upward.
The bullish trend continuous with this same pattern as long as the candlestick does not break through the bullish trendline and this will always be in the bullish continuation pattern and whenever the candlesticks break through the trendline, the bullish trend continuation is violated and the trendline analysis is invalidated.
• BEARISH TREND
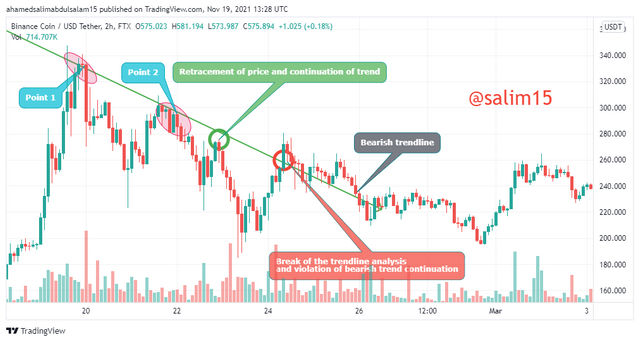
For a bearish trendlines continuation, two higher points are identified and straight line is drawn through the individual points, the bearish trendline serves as a resistance of which the candlestick hit and projects downward.
The bearish trend continuous with this same pattern as long as the candlestick does not break through the bearish trendline and this will always be in the bearish continuation pattern and whenever the candlesticks break through the trendline, the bearish trend continuation is violated and the trendline analysis is invalidated.
4) Pick up any crypto-asset chart and answer the following questions -
i) Is the market trending?
ii) What is the current market trend? (Use the chart to back up your answers)
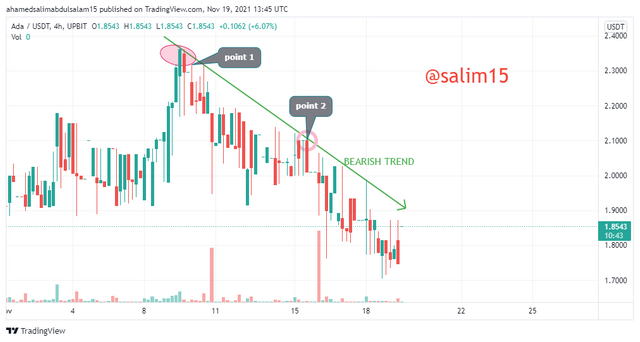
It can be seen from the 4-hour ADAUSDT chart graph above, we can see that the market is clearly trending in a downtrend direction specific.
The candlesticks movement pattern making lower highs and lower-lows, with each low lower than the previous low. Also, the trendline shows a bearish pattern of a bearish trend.
CONCLUSION
The concept of this topic is one of the most important course a trader needs to understand to be able to trade well in the market. This topic is discuss above elaborates so much concepts of the market using the chart graphs to do the presentation.
Understanding Trends initially explains the concept of bullish and bearish trend and also enables me to identify each of this trends on the chart graphs.
In addition, Market Structure is one of the component that is clearly explain above showing its impact in the market and how it is significantly operated in both bullish and bearish trend and same thing is been justify for Trendline.
Link to my old post https://steemit.com/hive-108451/@salim15/crypto-academy-s5w1-understanding-trends-homework-post-for-reminiscence01