Steemit Crypto Academy Season 2-Week 8 | Cryptocurrency Trading with Bollinger Bands by @salemumar5
بِسْمِ ٱللَّٰهِ ٱلرَّحْمَٰنِ ٱلرَّحِيمِ
ٱلسَّلَامُ عَلَيْكُمْ
QUESTION : 1
Define the Bollinger Bands indicator by explaining its calculation method, how does it work? and what is the best Bollinger Band setup?
1) Bollinger Bands Indicator and calculation:
Bollinger bands were introduced by JOHN BOLLINGER in 1980 and its a chart indicator to determine the volatility of market that basically deals the movement of market how fast and slow the market is though all the exercise of market is captured by Bollinger bands.
Bollinger bands is simply SMA based indicator that rely on price of moving average, Bollinger bands formula is not very useful to retained in mind because the computer is filled it automatically and you have to just apply the default settings that is [20,2] which is best default setting applicable by the professional traders and no fair changes are made but its upto you I suggest you my opinion no need change the default.
Bollinger band indicator is based on three lines middle band line, upper and lower band lines all lines are simply based on 20 moving average means that previous 20 candlestic formations average are based on this lines.
- Basic and Formula or method of calculating the Bollinger Bands indicator
Its a type of band which falls under volatility category of indicators though the deviation of price movement can be seen, deviation- there will be a mean and average value from which you can predict that how far is the current price so the distance between the current price and mean value is called deviation and how far the price can deviate from the mean value that is cover under Bollinger bands.
FORMULA:
STANDARD DEVIATION : how far price can move from mean value
BULL CURVED : 65 % value is rely in between 1 standard deviation from mean value. (means mean value is in middle and 32.5 is right and left too that distance the price you can find). 95 % value rely in between two standard deviation from mean value.
MIDDLE BAND 20 day simple moving average
UPPER BAND 20 day SMA + (20 day standard deviation of price *2)
LOWER BAND 20 day SMA -(20 day standard deviation of price *2)
Moving Average = Sum of prices over x days/number of days
Bollinger bands volatility is based on standard deviation the points I illustrated, though just making it simple the higher the volatility the more the bands will be widen and you can see that I major the deviations of that bands in simple word upper and lower below.
As professor taught the concept of lower and upper bands of 2 deviation 20 day moving average similarly with 10 days SMA connects us 1.5 deviation etc..
how does it work?
The working of Bollingers are based on the volatility of market and basically you can see the that whenever the volatility is high the band widen and similarly while low volatility the bands do in a shrinking position. Whenever the bands in shrink position - the position where the upper and lower bands come closer to the middle band thus its clearly indicating us that market surely is in the mood and any trend can be come in the market based on the volatility.
I will filter the some mistakes that traders might do so which there stop loss trigger most and they under go with losses, you must have to use the best matching indicator with bollinger bands because many traders do trading on the behalf of upper and lower band hitting but it works only few times but not necessary that it trigger all the time.
The basic structure of bollinger band to uses that three bands are there from which middle bands is the moving average of previous bands while lower and upper bands thus this bands are the standard deviations of them, this bands change with volatility of price higher the volatility the widen the bands and very lower the volatility the more the band shrink position low the volatility show normal bands though this is the situation and indicates us the buy and sell in market.
What is the best Bollinger Band setup:( what are the best parameters to use to get the most accurate signals when trading?)
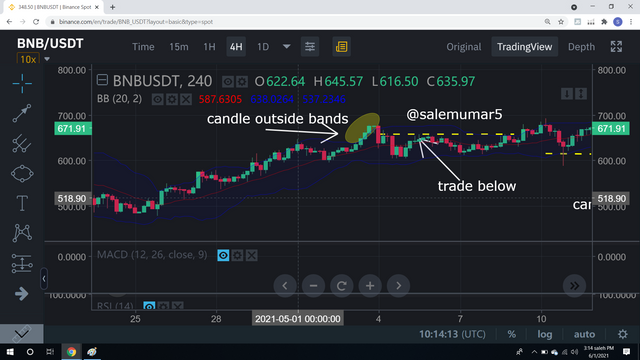
The easy method that I usually do trades while using bollinger bands and give almost good accuracy that you can see the image that there is candle that is out side the Bollinger bands though we can say that as per 2 deviation and candles are aligned with in the bollinger bands but if there is extreme high and extreme low than the candle would be form outside the bollinger bands. Though its a type of candle that is formed outside the is extreme high volatility whenever you see this type of candle that is formed outside the Bollingers than it would be the classic opportunity for the trader to trade in market and would give you juicy trades.
THE QUESTION ARISES IN YOUR MIND THAT HOW CAN WE DO TRADE AND HOW WOULD THISS CANDLE WILL BE FORMED??
Suppose as you see there is high volatility candle is subjected than wait for just one bearish candle though even so if the price also blow out the low of that candle too than price would move down trend and you would trade below there and short opportunity for traders can be observe.
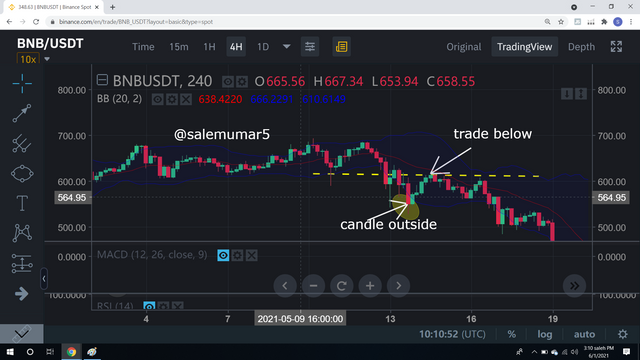
Similarly if the candle is form outside but this time in down position side and in this situation you get the bullish candle observe in upward trend now you can buy at when the high position and wait for the break than you can trade and buy the positions.
Most people do trades by setting there targets since you can also use the moving averages as the support because moving average work as a dynamic supports than you can use the upper moving average your first target if the middle one is break than use lower band for next target.
This is the best strategy through which you can get many classical and juicy trades.

QUESTION : 2
What is a breakout and how do you determine it? (Screenshot required)
As you all know that it is very important to know the trends in market however is you do trades you surely know that trends don't move in a straight line rather in zig zag movement higher high and giving a pull backs to each other and from which you can get the signals often and do trades in setting the target and wait for the break out of the market in this question I would not either elaborate you with the break out and the best strategy that give you juicy trades. While the trend is moving in straight in straight line than 20 ema is best while the trend is zig zag movement or showing many pull backs than bollinger bands are best for this trades.
While using bollingers bands give you perfect trades because it can identify the direction of trends while also taking this pull backs in to consideration and filters the false EMA signals.
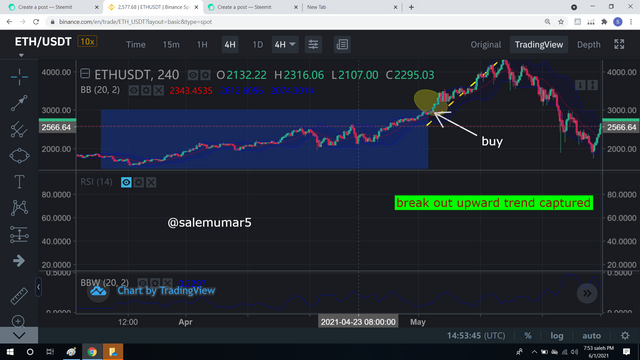
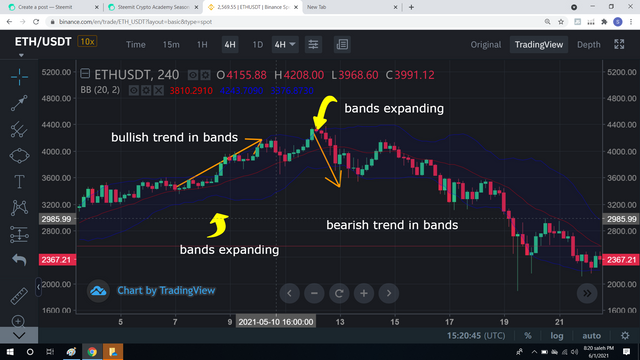
If the bands are contracting and shrinking markets low volatility period can be seen and expanding bands shows you the high volatility period as I explained you in detail although now I will elaborate with you guys the BB strategy for breakout in market, this strategy is based on predicting price breakouts using volatility what you need to attain is that
market volatility continuously changes from low to high volatility. If the market is in the low volatility period as you can see than it will definitely had the chances to give a breakout situation in price vice versa for high volatility as you can observe in image.
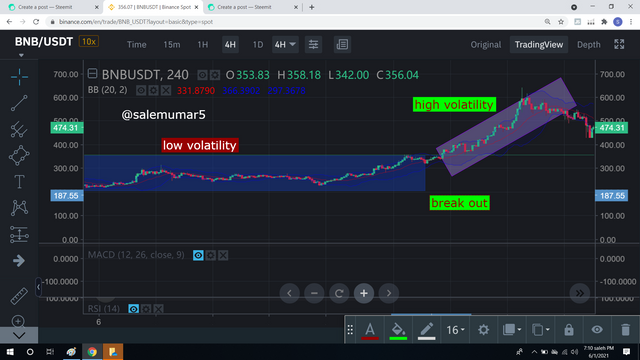
One more important think to observe the breakout in market we had judge but which direction the break gonna leads that thing is more important for a trader so you need to find out the market is in which range identify this by looking SMA middle line the line needs to be relatively flat like you can see and the both upper and lower bands should be closed to each other you can use indicator to judge them easily I used BBW to predict them more easily and give us the dimensions and help show how far the bands are from each other, If the BBW is low meaning that the gap between two lines are closed if they BBW is high means that gap is further part. For the PRICE BREAKOUT you need to the wait for the deviations lines to start expanding which can also be identify by rising the BBW. So this mean there would be a increase in volatility and breakout might be occurring.
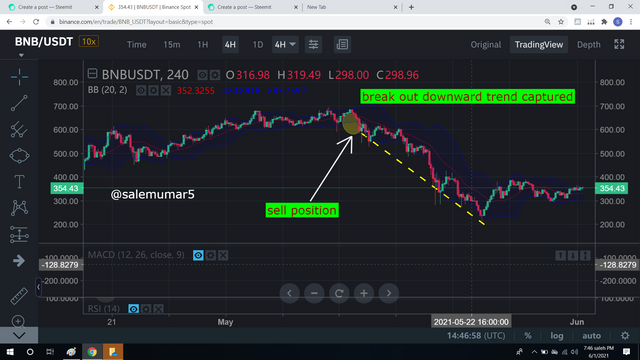
PRICE ACTION by this thing the direction can be predict as you can see in the image there are 3 red candles formed and giving the downward direction and on of them is seems outside the lower bands as (I told you the strategy before keep in your mind that concept too don't mixed up them) so based on the price action the BREAK OUT is more likely to be in downward position thus give us the best position to do trades and sett your sell position.
 '
'
QUESTION : 3
How to use Bollinger bands with a trending market? (screenshot required)
Here I will use the indicator for analysing the trends of market and made very easy for me and I used BBW indicator in previous question through which we easily judge the market breakout positions so lets elaborate it in detail.
The name of indicator through which can get the dimensions of price and bands is MONEY FLOW INDEX this is how we do it, first sett the value of indicator to 50 through which you can get the simple lateral line in centre through which it can ease you to predict that if the green line cross the white line indicates you the bullish trend in market gonna be observe and if the green line cross below the white line it indicates you the bearish signal.
Now we will combined them with Bollinger bands thus it will easily give the trends in market lets make it more practical.
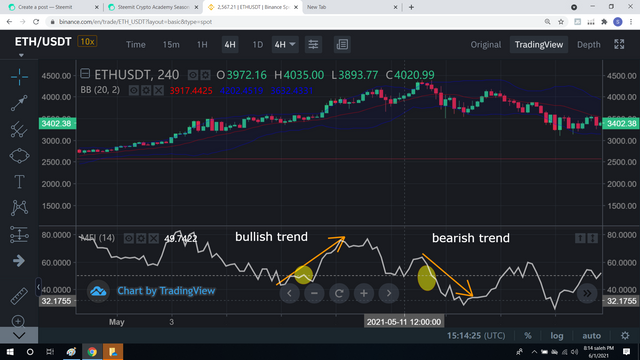
- This image is the classical view of market trends BB and MFI indicators
QUESTION : 4
What is the best indicator to use with Bollinger Bands to make your trade more meaningful? (Screenshot required)
While am using simply bollinger bands for taking trades in demo I saw there is very difficulty in judging the price mechanism I got the dimensions and price up and down trends but can't get perfect knowledge about the price because sometimes the price cheated me and obtains a new position like first the price hit upper band than give me the down ward trend position and than while hitting the down ward means lower band again show me the bullish period it happens few not all the time look at the chart below
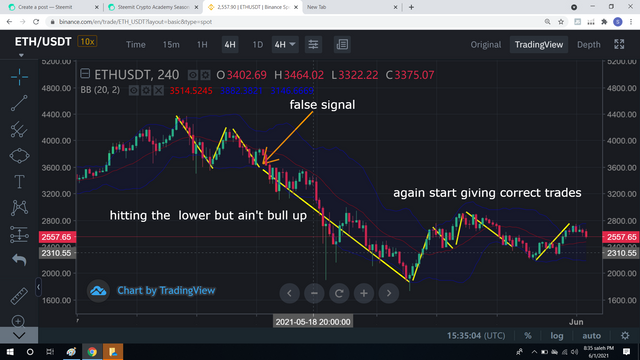
look I made it simple for you to understand that positions and target hits the main but can't give you reliable trades as a professional trader you must need some remedy for this and a perfect thing that give you classical trades.
For this i will use RSI and MACD which gives me the perfect analysis of price movement lets do some practical work.
- Where should we can take trades and I will highlight the false trading areas where you ain't take trades because any of them is not giving the guiding areas of trading.
- In below area you can see that there is false signals and some indicators don't allow us to trade this is what the strategy belongs and suggest us that take trades on the behalf of many indicators minimum 3 that I should you.
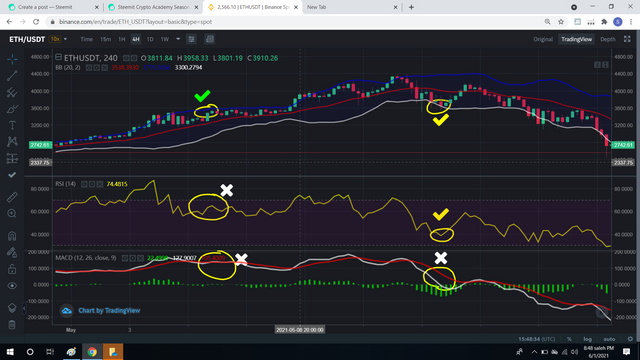
-Trading and signals that allow us to take classic and juicy trades using RSI MACD AND BB. Below chart is the practical demonstration of it.
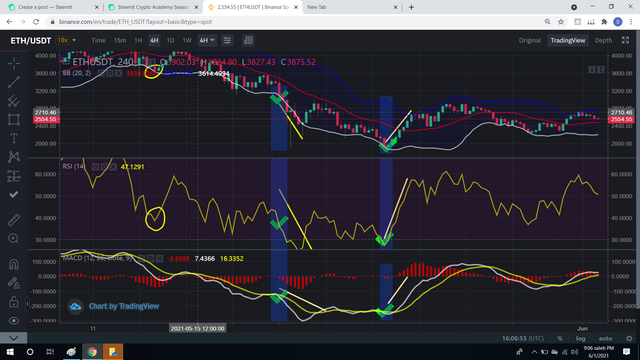
you can see in the image above I had highlighted the targets that is the best trading signals via using all indicators. Where as RSI give downtrend 29.7 MACD 132 position and finally you can see that BB touches the lower segment if bands and one more signal I illustrated for you.
Through using this signals and indicators you can be in better trading cycle and easily predict the market trends by using this indicators although you can also see that how easy and simple this indicators work and give us the best trading position in market.
QUESTION 5 & 6:
What timeframe does the Bollinger Bands work best on? And why? (Screenshots required)
Review the chart of any pair and present the various signals giving by the indicator Bollinger Bands. (Screenshot required)
As I am beginner and I do short term trades in market although its known as scalping in other words you can use 15 to 30 mins chart through which you can get profitable trades while using bollinger bands. I set this chart with 15 mins time frame i mentioned because of scalping it give us good trading short time period. As far you can also use the time frame in long term but it n make difficult because making trend line and high investment needed so As i am impatient trader though I used to do scalping and do short term trading minimum 1 hour time frame. There you can see 10% 5% profit can be observe.
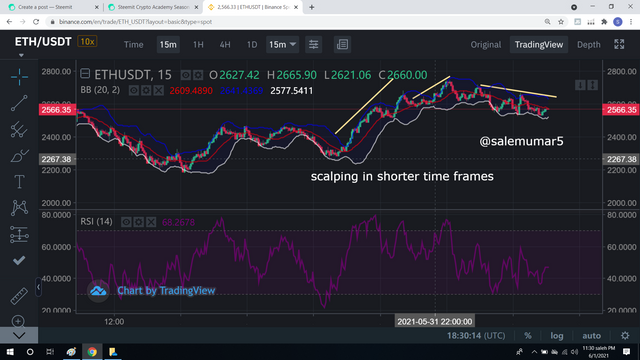
My mean of doing the scalp trading because of short time period profits thus I enjoy and use to do this trading as it is best for beginners because you can enjoy profitable trades.
NOTE: FOR INTRA DAY TRADING 5 min 10min chart time frame, FOR 2-4 TRADING 15 min 30min 1hour chart time frame, FOR LONG TERM TRADING daily chart time frame.
Review the chart of any pair and present the various signals giving by the indicator Bollinger Bands. (Screenshot required)
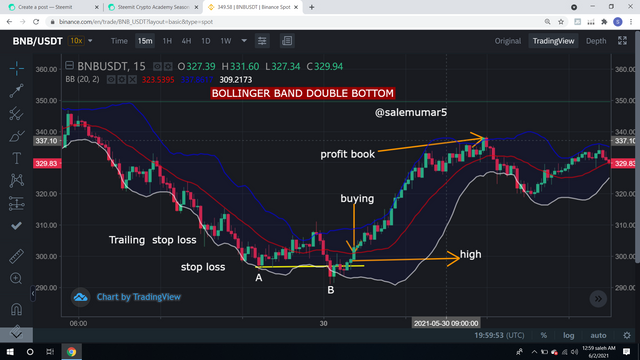
Now we will use the the various signals and do the buying and selling signals, first of all we will do double bottom and double top buying selling strategy.
BOLLINGER BAND DOUBLE BOTTOM buying strategy by analysing the chart we can see after the end of bearish candle we can see there is bollinger bands double bottom now for buying we have to look at where the bottom of bollinger bands bottom B end thus where it is formed lowest candles right after wait for the next candle if it is closed high of bottom B there the signal of buying can be seen. For stop loss use the bottom B lowest and previous candles formation and sett the target where it closed. One more thing keep in your mind the RRR rule 2% from the distance of BOTTOM A TO B, if the difference is beyond don't do trade. For trailing stop loss keep eye on candles formation and do the trade buy setting your target and don't make greedy just book reasonable profit and place trailing stop loss in parallel. Profit book is the place where you have to check some concept that when ever you observe the negative stance in market and choose the wick formation while it hits upper bands do book your profit.
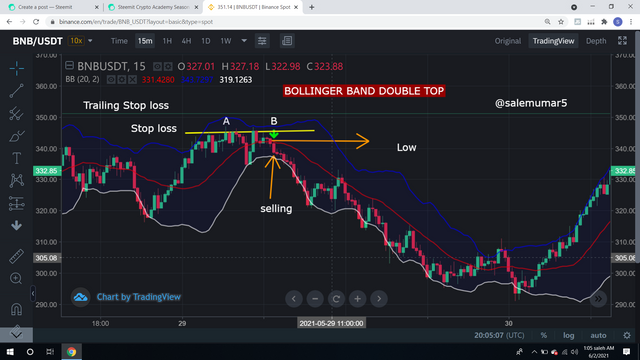
BOLLINGER BAND DOUBLE TOP selling strategy you can analysis the chart after the bullish trend in market finishes thus the bollinger bands make a double top face in market, for selling when ever the bollinger bands top is formed those candle which is closed double top's candle highest thus if the next candle formation is below previous double candle's high than you can see that there is position of selling. Same as I mentioned that for stop loss strategy we have checked that top's B highest candle formed thus make your stop loss where the high of this candle is made. One more thing RRR stop loss and selling period difference is less than 2%. For trailing stop loss do trade by using trailing stop loss also. Main thing profit book position where the bollinger band or any indicator you use ain't give the negative signal don't book the profit till if there is negative signal immediately book your profit and you can also do book profit by lower band strategy also.
I illustrate with you the best buying and selling zones signals through which you can easily maximize your profit
- THIS IMAGE BELOW IS THE SIGNALS OF BOLLINGER BANDS JUST
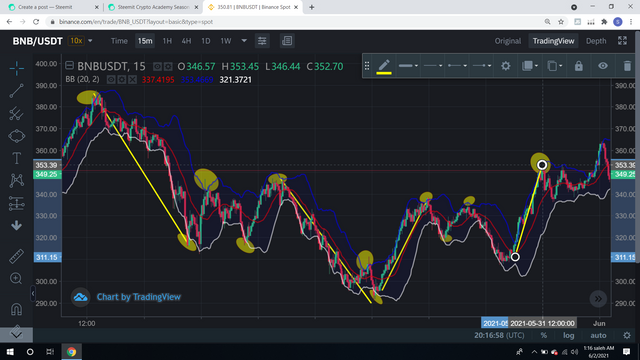
DO attain with indicators in it to get more reliable trades in it though I had mentioned above and I make many much juicy trades from it you can also do so buy taking it correctly.
CONCLUSION:
As so far I usually do use moving average EMA but through this I felt that there would be good trades can be extracted from chart so do introduced all methods of trading from which you can get classical trades.
My analysis for this indicator is quite good because there is low chances of getting false signals via from get rid of that you can use different indicators also that I do so.
Howbeit for beginners it is the best indicator for short term trades and you can get easily reasonable profit by using this but do demo practice while using paper pen although do trade in simple and easy ways from which BOLLNGER bands are also one of them.
HAPPY TRADING GOOD LUCK..
Cc:-
@steemitblog
@steemcurator01
@steemcurator02
Hi @salemumar5
Thanks for participating in the Steemit Crypto Academy
Feedback
You were too wordy and very unclear in most of your explanations put across. Generally, your question approach was poor. You should try to be straight to the point as you answer the various questions in the homework task because that's partly what proves your understanding of the information you are providing. The screenshots you provided were not clear. That dark mode was a wrong choice as it made all your work to appear blurred.
Homework task
4
Respected sir @yohan2on
I had give complete explanation but I also discuss the facts though post became to lengthy and professor told us to make post above 300 words not any limit is given. I explained question but in detail and simple language. As far of screen shots I used them because of eye problem and just this post is not rated well other wise my all homework posts carries this type of screen shots. This post is made by me and I used much effort to elaborate it.
Please tell me where I didn't gave clear explanations ?? And where did I lose my potential of ain't explaining the homework.
Hello @salemumar5,
Thank you for participating in the 8th Week Crypto Course in its second season.
Unfortunately, your post will not be voted on, because you do not have at least 150 SP in your wallet.
Respected sir @kouba01 hy hope you are good, my issue about this post is that I put all my effort and give the best explanations regarding bollinger bands but ain't get rated well its a humble request to do recheck my post for my satisfaction than I will accept whatever your decision is waiting for your positive response.
@kouba01