Crypto Trading Strategy with Triangular Moving Average (TRIMA) Indicator - Crypto Academy / S6W4 - Homework Post for @fredquantum.
QUESTION:1
What is your understanding of the TRIMA indicator?
Introduction and understanding towards TRIMA indicator
TRIMA indicator commonly famous by moving averages which are quite lagging indicator in technical analysis though among them to making perfect combination in the ground of technical analysis SMA, EMA and TRIMA Indicators plays a vital role to handle these lagging but they are trying though the volatility issue has been worth alot by TRIMA whilst SMA and EMA also found worth full indicators in in high volatility.
Though just like SMA TRIMA provides the users to identify the current market conditions by the analysis of specific period set in tool, whilst the price action is reacts with the oscillators over the moving averages which notifies the trader a smooth market and ignoring the noises occur during short term price momentum.
Held TRIMA also engages your trade in average price with the accumulation of specific periods just like in SMA whilst you can make trend analysis by the help of oscillation occurs in market by TRIMA where the traders extract the upward and downward trends this Indicator also reflect the patient while the price integration occurs for trend reversal since it aint reacts with market rapidly but indicates you join the market after a complete occuration of new trend whilst other moving averages had lagging problem because they react to quickly with price volatility.
The TRIMA also pulls up the double dealing strategy where you can make trade by implementing Trima twice in your chart and it will enhance your trades by providing you more crossovers held these crossover should be rectify by other indicators to maintain more hope and reliability towards your trade.
QUESTION:2
Setup a crypto chart with TRIMA. How is the calculation of TRIMA done? Give an illustration. (Screenshots required).
Adding TRIMA on chart and calculation
- Go to tradingview official site by clicking the link
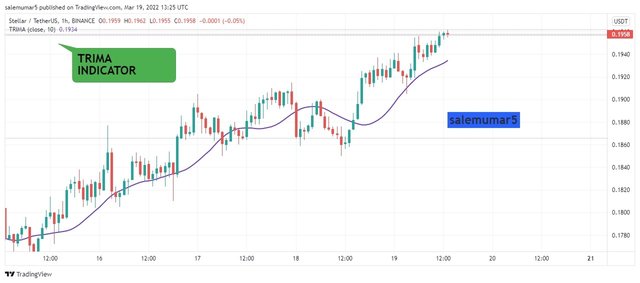
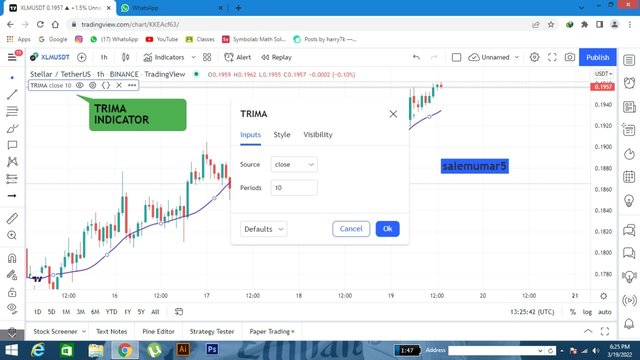
- Here you can see the indicator option click input Trima indicator after that you can see that Trima indicator is established in your chart.
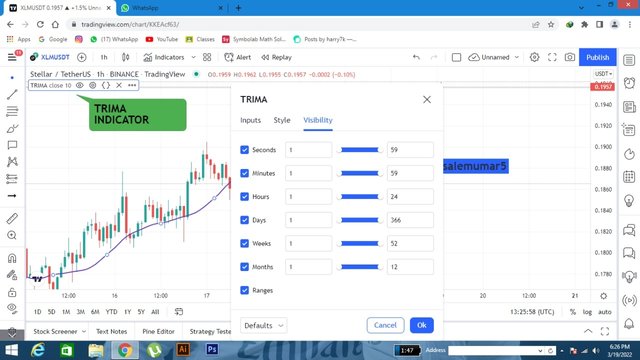
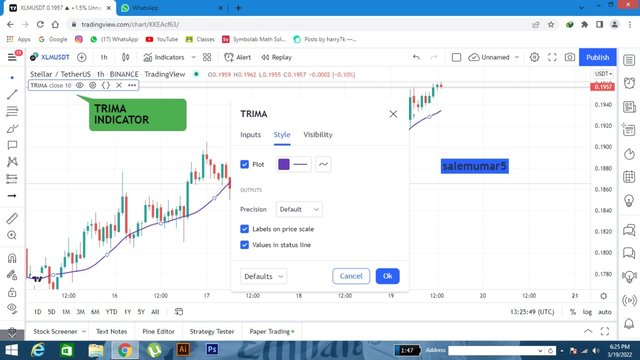
- Here you can see the Trima indicator is enabled you can visit the setting area where you can change the periods, style and colours which i sett as default this would be help you in below questions where you need to adjust the period of TRIMA Indicator.
These features are set default which you can easily implement to trade.
The TRIMA indicator involves the moving averages thiugh here the calculation also visualise by using SMA where the Trima indicator reflects us the smooth and high volatility againt SMA. Since SMA calculation is simply based on the average period by dividing the number of periods occur held these periods are calculated according to the time frame you embedded in your chart, here the TRIMA calculation also just same by adding the number of SMA and divided by the numbers of chances occur by SMA so these SMA will double the effect resultantly provides you the more efficient and smooth double average indicator effect which can drive in drive jn high volatility.
Formula for SMA is;
SMA = (P¹+P²+P³...Pn)/n
Where P = number of periods occur according to your time frame and n= number of occurrences of given period.
Formula for TRIMA is;
TRIMA = (SMA¹+SMA²+SMA³...SMAn)/n
Or
TRIMA = Sum of all(SMA values)/n.
These SMA are the TRIMA periods and n number of these SMA occurrences.
Calculation for TRIMA;
The chart below i enlightened the three SMA with 4hrs fhsrt for better understanding held the numberif occurrences are 3.
As you can see the;
SMA1=
SMA2=
SMA3=
NUMBER OF OCCURRENCES= 3
Here i will do the sum of all SMA and divided them by number if occurrences where i got. ----- which stated the current TRIMA average ----
QUESTION:3
Identify uptrend and downtrend market conditions using TRIMA on separate charts.
Upward and downward trends with TRIMA
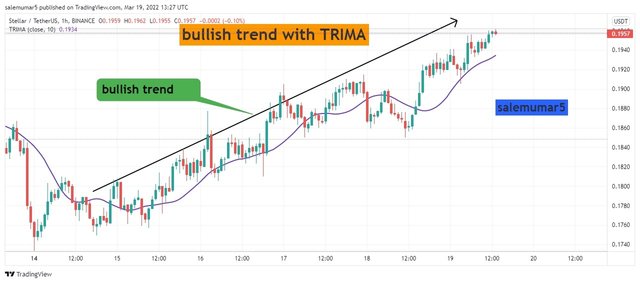
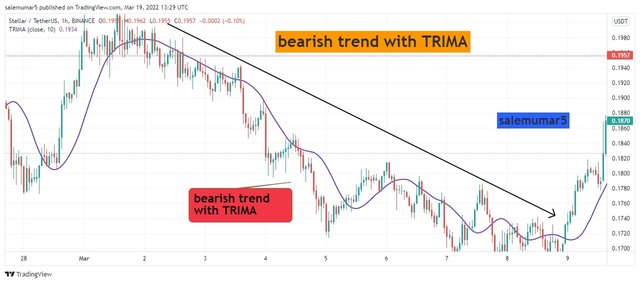
In upward trend direction Trima state that you should use them according to it dynamic mode by setting the chart in 10 close periods which results you to obtain dynamic support for uptrend and dynamic resistance as downward trend. The price make retest in both scenario and directions you according to your trend.
Lets analyse them in chart;
Upward trend with Trima
The chart below is BNB/USDT where you can see the time frame is 4hr and the trima indicator moving upward by making a dynamic support areas this can also visualise if you know the understanding of higher highs in market this also obeys Trima indicator by retest and moving upward this trend in bullish mode with Dynamic support of TRIMA lifting the price upward.
Held the breakout would be observed when the the resistance of TRIMA indicator has been broken which i enlightened, though just after that in next candle you can take your long position and price makes a retest and continuous in upward motion.
Downward trend with Trima
The chart below is BNB/USDT where you can see the time frame is 4hr and the trima indicator moving downward by making a dynamic resistance areas this can also visualise if you know the understanding of lower lows just same as higher hugh in above whilst in market this also obeys Trima indicator by retest and moving downward direction this trend in bearish mode with Dynamic resistance of TRIMA lifting the price downward.
Held the breakout would be observed when the the support of TRIMA indicator has been broken which i enlightened, though just after that in next candle you can take your short position and price makes a retest and continuous in downward motion.
QUESTION:4
With your knowledge of dynamic support and resistance, show TRIMA acting like one. And show TRIMA movement in a consolidating market. (Screenshots required).
Trima behaviour with support, resistance and consolidation market
The price action always makes new position in market by the fundamentals and sometimes obey the technical wording so these Technical Indicators are there to provide the confidentiality, reliability and validity of our trades by the integration historical price action wordings. Though these indicator help alot to maintain the better trading and signals fruitful results, same as Trima is one of them which you know the mixture of moving averages and also provides good and efficient effective methodology with support and resistance.
Also Trima is also a trend based indicator which we explore in above questions though they provides good relationship with dynamic support and resistance by following the price trends in both directions. These levels are also captured in Bullish ann bearish whee price makes a retest ment and moving in their means of trend. Held TRIMA will also helps you to identify the consolidation phase in market by the command of oscillation in it.
Let's analyse them in chart with practical approach.
Trima as dynamic Resistance
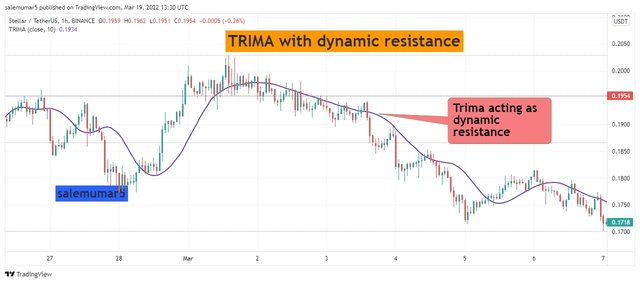
The Dynamic Resistance can observed when the price action obeys the indicator line with making lower lows in market thus there you can see when the price comeback for retest there should be bounce back from resistance point which is Trima line though there you can easily found the Dynamic resistance area. The chart below price action confronting the Trima indicator also they looks like a dyanmic resistance also this trend is pure bearish and dynamic resistance level.
Trima as dynamic Support
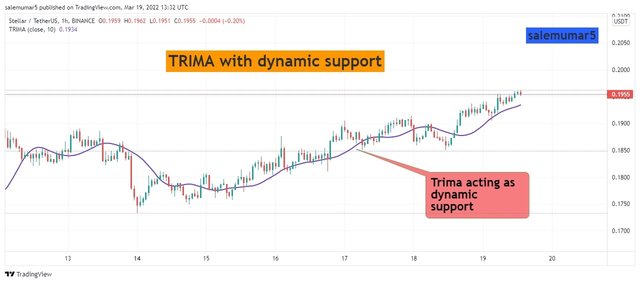
The Dynamic support can observed when the price action obeys the indicator line with making higher high in market thus there you can see when the price comeback for retest there should be bounce back though there you can easily found the Dynamic support area. The chart below price action confronting the Trima indicator also they looks like a dyanmic support also this trend is pure bullish and dynamic support area.
Trima as consolidation market
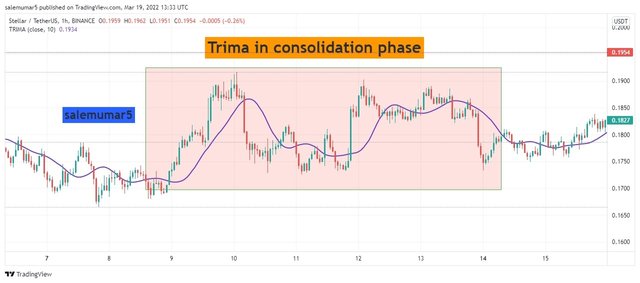
The consolidation phase in the market is affirm where the oscillation between price and trading levels are so high ultimately this is called volatility in market, here the price makes irresolute signals and waving in particular pattern thus this is easily judge by TRIMA because Trima indicator having great practice over oscillation and consolidation phase also obeys the oscillation between price making a support and resistance levels many scalpers do scalo trading but the market can take to any directions though maintain RR before entering the trade. The trade also having heavy momentum from buyers and sellers sides though the market can turn in to any directions. Held TRIMA helps you to identify this phase easily below you can see.
QUESTION:5
Combine two TRIMAs and indicate how to identify buy/sell positions through crossovers. Note: Use another period combination other than the one used in the lecture, explain your choice of the period. (Screenshots required).
Buying and selling areas with TRIMA
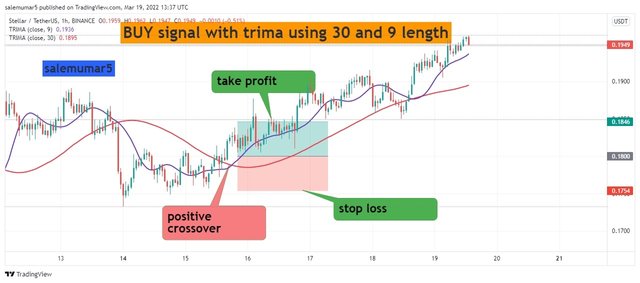
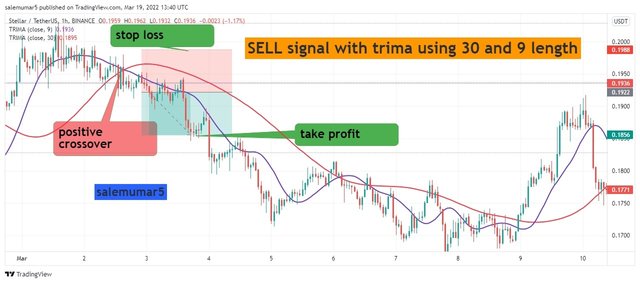
TRIMA Indicator is very effective and efficient indicator for price oscillation although the indicator also used by in of the technique by emerging 2 TRIMA indicators. This will provide you the crossover occurs in market these crossover can be bullish and bearish, though this is very useful while taking the long and short position in market. The professor includes the 20 and 10 period Trima oscillations we will try 50 and 80 periods for long term trades in 4hr time frame.
Trima with buy signals
The crossover for bullish cycle can be analysis by using 50 and 80 periods oscillation for long-term trade and maintaining the bullish Cycle with 4hr time frame also i am using rsi in parralel for more confidentiality in my trade and to achieve better breakouts. The price you can see moving upward and there is a positive crossover and MACD also showing positive crossover now the price should move in upward direction though long position can be trade with RR 1:2 according to your risk management for bull run.
Trima with sell signals
The crossover for bearish cycle can be analysis by using 50 and 80 periods oscillation for long-term trade and maintaining the upward trend Cycle with 4hr time frame also i am using MACD in parralel for more confidentiality in my trade and to achieve better breakouts. The price you can see moving downtrend and there is a positive crossover for sell position is observed and MACD also attaining the crossover now the price should move in downward direction though short position can be trade with RR 1:2 according to your risk management for bearish cycle.
QUESTION:6
What are the conditions that must be satisfied to trade reversals using TRIMA combining RSI? Show the chart analysis. What other momentum indicators can be used to confirm TRIMA crossovers? Show examples on the chart. (Screenshots required).
TRIMA trend reversal with RSI and other indicators
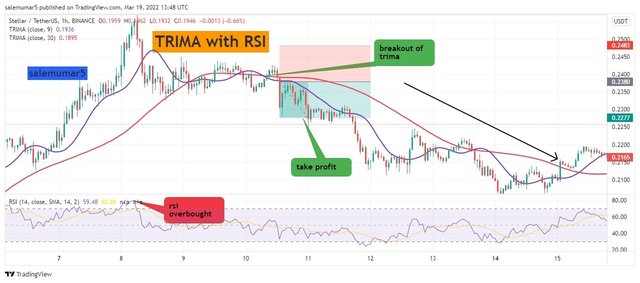
Here you can see below the Trima indicator is smoothing with rsi gibing bearish signals, where the Trima shows a breakout for bearish zone same where the rsi is also oversold and there they confirmed us bearish zone in market which you can see below.
Here you can see below the Trima indicator is smoothing with rsi giving bullish signals, where the Trima shows a breakout for bullish zone same where the rsi is also oversold and there they confirmed us bearish zone in market which you can see below. I trade in market after confirmation of more indicators because there is little bit lagging in both rsi and Trima but ultimately provide us bullish zone.
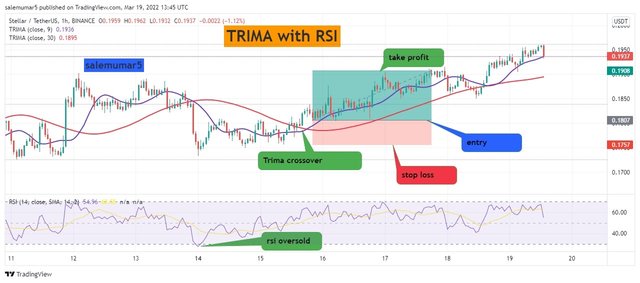
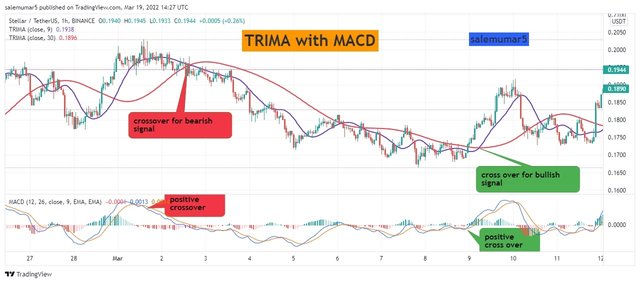
Here the chart is established with Trima and MACD where they are giving bullish and bearish zone in parralel, where the breakout are perfect and bearish signal are also in support with MACD. Though both are momentum indicators playing good role in this market.
QUESTION:7
Place a Demo and Real trade using the TRIMA reversal trading strategy (combine RSI). Ideally, bullish and bearish reversals. Utilize lower time frames with proper risk management. (Screenshots required).
Demo and real trades with TRIMA indicator along RSI and others
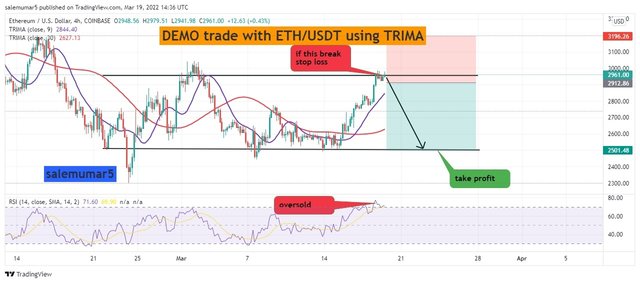
The chart below is ETH/USDT with 4hr time frame signaling us bearish market whee the correction must be execute. Though i make entry point according to Trima, resistance/support and rsi. As you can see the rsi is oversold means bearish Cycle must come while the Trima also showing downward market where the resistance must give a pull back to price again also you can see the minimum pullback must be there at lower and upper bands of trima.
The demo trade of ETH/USDT;
Real trade:
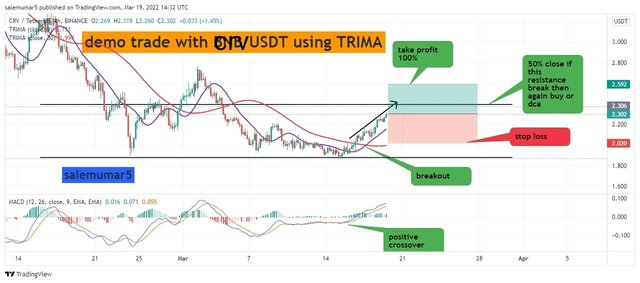
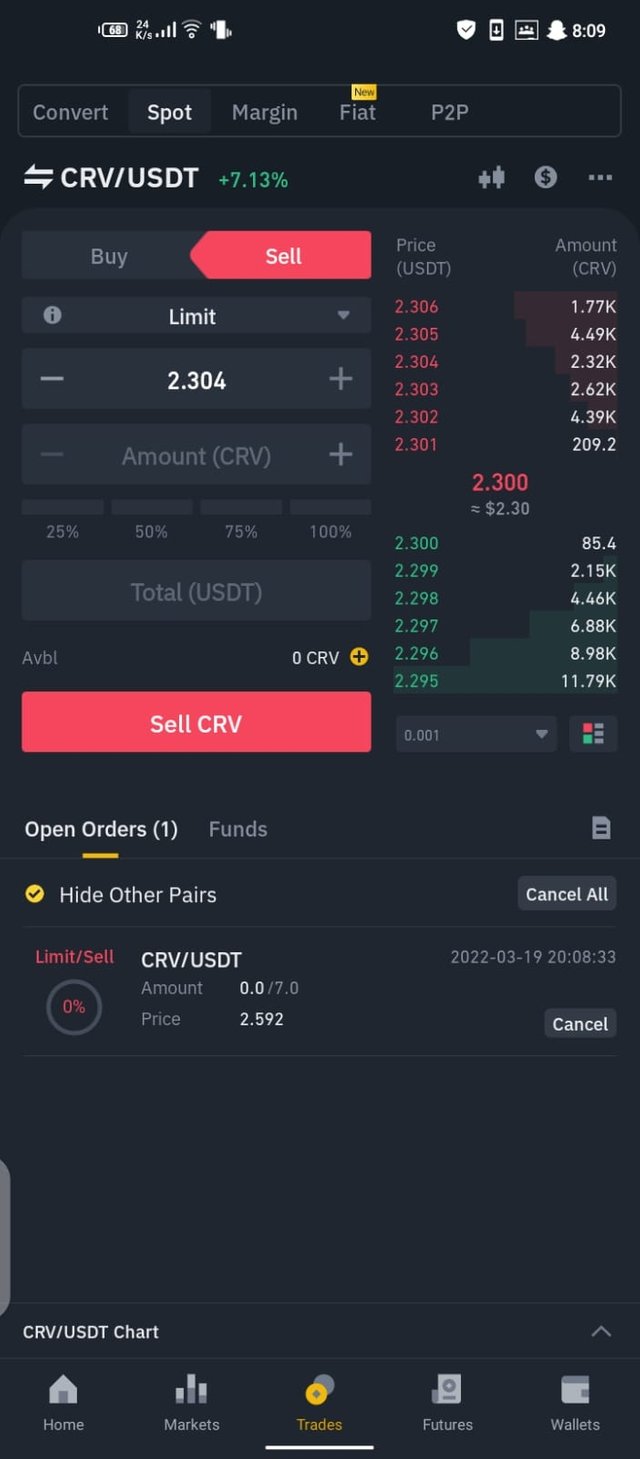
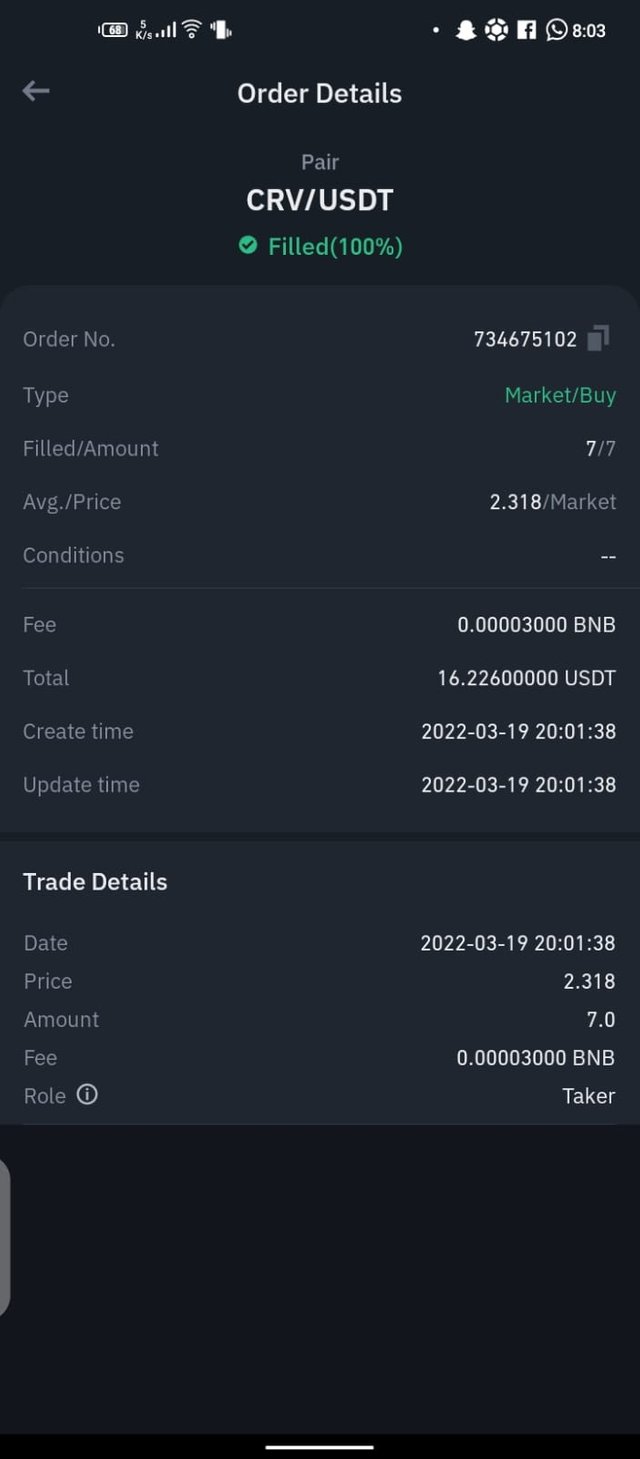
This chart is CRV/USDT which is showing buy signal where the price should break this resistance if this resistance will broke then must be bullish cycle will occur because MACD also give a positive signal for upward motion although resistance level should be hit where i will do DCA and close my half trade if that Breakout would be strong than i will continue my trade for long term.
Trade history original:
QUESTION:8
What are the advantages and disadvantages of TRIMA Indicator?
Advantages and disadvantages of TRIMA
Advantages:
1 Provides you the smooth direction in market by ignoring the volatility.
2 Indicator is very efficient while using with different Indicator in parralel like RSI, MACD and ICHIMOKU.
3 The indicator is less complex and complected than others also having simple calculation and parameters.
4 It can Provides you bearish and bullish signals by the help of dynamic support and resistance which not fool you by using lines instead you can use TRIMA to follow the trend reversals.
5 It has double smoothes average which waves with the price in best action and signals fruitful results.
Disadvantages:
The indicator is lagging in many areas where we adjust them with different Indicator though not a perfect result ain't extract.
The indicator provides many false signals which can truly liquidate you in futures, though aboud using this Indicator in future.
Trima can provide you good crossover but not enough to trade in volatile market becuase consolidation phase immediately occurs in high volatility.
Conclusion
The Trima indicator is very helpful and good technical indicator which can give us fruitful results if we use it with different momentum indicators which we used in question. Since the indicator also gave us dynamic Resistance and support which us very useful in trend reversal though no need for making a design and chart just apply this indicator and get extract fruitful results.
Thanks professor @fredquantum for delivering such a informative and useful indicator to help us in our trades
