Metric Indicators - Crypto Academy / S5W2 - Homework post for pelon53.
Created with Splendid Logo designer

1.- Indicate the current value of the Puell Multiple Indicator of Bitcoin. Perform a technical analysis of the LTC using the Puell Multiple, show screenshots and indicate possible market entries and exits.
The Puell Multiple indicator is one of the key indiactors ivestors use to forecast the state on a particular cryptocurrency's supply and demand. This indicator is mainly focused on the activities of miners with regards to their revenue generations with their coins earned from mining. The puell multiple indicator is only used by Proof of Work(POW) based coins, primarily BTC and LTC as they are generated by miners with their computing power.POW miners are mainly thought of as compurlsory sellers, as they need to sell some of their earnings to cover the cost of mining (like mining hardware). Their activities in general have a great influence on the price of the coin over time. The indicator takes the mining data of the coin and matches its daily insuance with the 360-day moving average to calculate the Puell Multiple indicator value of the coin. Through the value, we can know if the miners are selling their earnings or hodling.
On the Puell multiple chart, the puell multiple value ranges from 0.1 to 10 (in green strips). The values from 0.1 to 0.5 are in the green line and they signal large returns for investors, as the gains of miners with respect to their annual profitability are low here and they are not selling. Investors can buy the coin from here for higher returns as it is usually preceded by a bullish market.
The values from 4 to 10 (in red strips), on the other hand, indicate higher revenue generation for the miners. This is where they usually sell the earnings for more profits. Investors usually take profit from here and it is usually preceded by a bear market due to selling pressure by both miners and investors.
The Puell's Multiple Indicator is generated by taking the ratio of the USD equivalence of the coin's daily issuance and the USD equivalence of the 365 Moving Average daily coin issuance.
Thus;
Puell's Multiple Indicator Value = Daily Coin Issuance (USD)/365 Day Moving Average (USD)
The current value of the Puell Multiple indicator for BTC can be found in the graph below, which contains the BTC price chart and the Puell Multiple indicator values. The value, as at the time of writing, was 1.4044866
.png)
BTC puell multiple chart from lookintobitcoin.com
Analysis of LTC with the Puell Multiple Indicator
I performed the analysis with the Puell Multiple indicator through https://studio.glassnode.com/. The chart covers the data from 18-05-2014 to 25-11-2020. As discussed above, the chart contains green strips at the far bottom, representing the periods when LTC is undervalued, and the far top contains the red strips, which represent periods when LTC is undervalued. Based on the price data of LTC, we can use the rt to show how the price of LTC behaves when miners hodl or sell their earnings.
.png)
Puell Multiple Indicator chart of LTC. from https://studio.glassnode.com/
The chart above contains only the chart of the Puell multiple indicator without the price. It can be seen that, there are periods when the indicator will enter the green line. This sends a buy signal to buyers as it indicates that there are low earnings for miners at this time. Investors who buy from here are likely to earn more profit as it is usually followed by an uptrend. The red zone, on the other hand, signals investors to sell their holdings as the miners are gaining profits from this zone by selling out their LTC earned. The selling pressure bought both miners and investors. As you can see from the chart, there is always pressure on the indicator when it hits either the buy or the sell zone. This indicates that it will be followed by a significant rise or fall in price. Now let's compare the indicator with the price and see how they are related to each other.
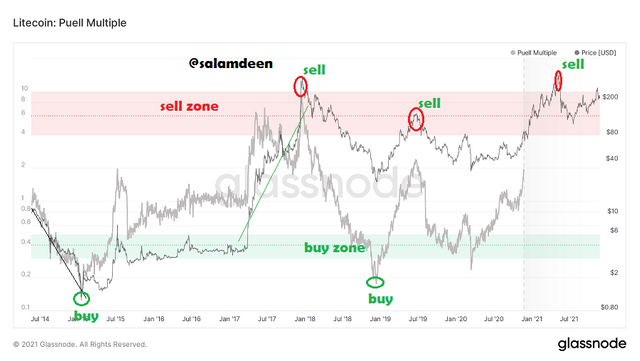
Puell Multiple Indicator With LTC Price Chart from
Let's consider the chart above, which contains the Puell multiple indicator (in grey) with the price chart of LTC (in black). It can be seen that, the chart contains data from the Puell Multiple Indicator from May 18th, 2014 to November 25th, 2020. The Puell Multiple value dropped significantly from 0.94243602 to a bottom peak of 0.1376555 on May 18th, 2020.This indicates a decrease in the profitability of Litcoin miners, and it was accompanied by a significant drop in the price of LTC from $10.35 to $1.14 in January 2015.The indicator was wandering around the undervalued zone, which left the price of LTC between 1.0 and 1.85 until June 2015, when a little buying pressure raised the indicator value to a peak of 1.965511 in August, and it was accompanied by a rise in price up to $7.56.
Since September 2015, after the first LTC halving, which reduced the reward per block to 25LTC, the indicator value has remained between the green and red zones, allowing the price of LTC to remain in the $2 to $5.12 range.LTC then gained a drastic movement to a peak of 11.73. The indicator value skyrocketed to 2.735 in April 2017. From there, the puell value increased, implying that profitability began to rise gradually, accompanied by the price.
A little drop in the indicator value as it entered the sell zone at 5.06 around September caused the price of LTC to decline from a peak of $88 in September to as low as $50.94 in August 2017. From there, The indicator value kept on increasing to a peak of 7.985 and the price of LTC increased to its 2017 all-time high of $356. This was a clear exit signal, which caused selling pressure, and the price of LTC dropped to as low as $23 around December 2018. By then, the indicator had dropped to a value of 0.2, which was an entry signal, and the price of LTC increased from 23 dollars to a high of $135 dollars. This was around mid-2019
. The indicator was in the undervalued zone from the third quarter of 2019 to the middle of 2020, which was a clear entry zone for investors as the last Litecoin halving event occurred in August 2019, which is a signal that, the rewards of miners will be reduced. The data ended in November 2020, and the indicator value can be seen moving higher towards the overvalued area with the price increasing along with it.
2.- Explain in your own words what Halving is, how important Halving is and what are the next reward values that miners will have. When would the last Halving be. Regarding Bitcoin
Bitcoin halving is a practice started by Santoshi Nakomoti after the creation of BTC in order to keep Bitcoin inflation under control.This activity is being used by crypto currencies that are built with the proof of work consensus mechanism. It involves cutting the rewards of miners by half after a specific number of blocks are produced. The total supply of BTC is limited to 21 million coins, and the new coins only get into circulation through the rewards earned by the miners. The halving event always occurs after 210,000 blocks are mined. It will take approximately 4 years to mine these numbers of blocks as the Bitcoin network is capable of producing a single block in approximately 10 minutes. Starting in 2008, BTC miners were rewarded with 50 BTC for each block produced.
They received this number of BTC until block number 210000 was mined. This means that, after the 210,000 blocks were mined, the BTC in circulation was 10,500,000.00 BTC, that is, 50x210000. The first halving event occurred in 2012 after the block height of 210000 was mined. From there, miners started receiving 25 BTC after each block. This reduced the supply of BTC by half. The halving activity is an automatic event that is scheduled to happen after every 210,000 blocks are mined. This trend will continue until the year 2140, when the last block is estimated to have been mined, as the reward per block will become negligible and finally deminished.
The Having event is very significant in the development of BTC and cryptocurrency as a whole. This follows the concept of demand and supply. As the event keeps reducing the supply of the coin, the demand remains constant or even increases with time. This, in turn, reduces inflation as the coin keeps on adding more value. This is accompanied by a significant rise in the price of the coin. The halving also makes the block generation a competitive one, which keeps the network more secure as time goes on.
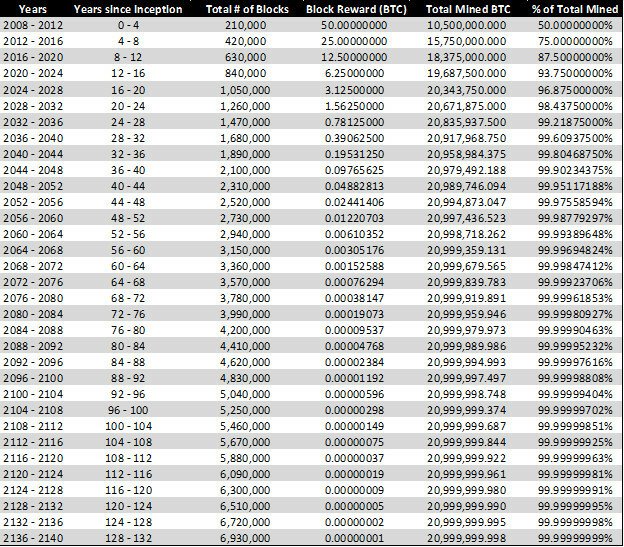
Consider the picture below from publish0X.com
Source
From the picture above, it can be seen that, the current reward miners gain per block is 6.25 BTC. According to the data in the table, there are currently over 18.375 million** BTC in circulation, and by the time of the next halving in 2024, there will be 19.687 million BTC in circulation, representing 93.75% of the total BTC to be rewarded, leaving only 6.25% of BTC unrewarded after 2028, and only 3.125% of BTC unrewarded after 2028.I observed a fascinating scenario from the table which shows that, after every halving event, the percentage of BTC left unrewarded is equivalent to the number of BTC miners gained in the previous year's halving. Following the 2028 halving, only 3.125% of total BTC will be left, with the previous reward per block being 3.125 from 2024-2028.
Beginning from 2008, theres goin to be 33 halving events in BTC. The 33rd halving is expected to occur in the year 2140 (132 years after the first event), when all 21 million BTC will be rewarded after 6.93 million blocks have been mined.
3.- Analyze the Hash Rate indicator, using Ethereum. Indicate the current value of the Hash Rate. Show screenshots.
In proof of work blockchain networks, miners have to solve complex mathematical problems with their computing power to generate new blocks. These mathematical functions are mainly in the form of hash functions, where miners have to take the input and then produce an equivalent hash of the input. Hashrates can then be defined as the number of hashes a particular processor or network is capable of producing at a particular time. With regards to blockchain networks like Bitcoin and Ethereum, the hash rate is usually measured in mega hash per second (MH/s), Giga Hashes per second (GH/s), or Tera Hash per second (TH/s), meaning million, billion, or tera hash per second, respectively. It is important to note that there is no specific way of determining the hashrate, the mean hashrate is usually taken from the active miners at a particular time.
The hash rates of a network have a direct impact on its miners in such a way that, if the hashrate is higher, there is a higher chance of a miner mining a block, This gives the miners the opportunity to gain block rewards. As new miners usually join the network with powerful tools, as it keeps on developing, this will increase both the hash rate and the mining difficulty. The increase in the hash rate will increase the miners' revenue, which is a good signal of the coin's increase in value. I have analysed the chart containing the price of Ethereum and its hashrate, which forms the hashrate indicator in the paragraphs below.
The picture below is a chart from https://studio.glassnode.com/, which contains the price of Ethereum and its mean hash rate.
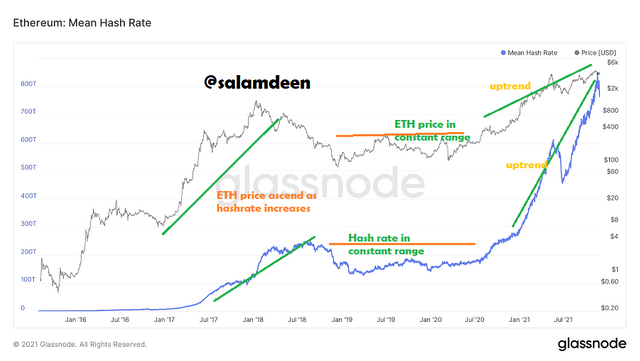
Ethereum price and hashrate from https://studio.glassnode.com/
The chart contains data from July 30th, 2015 to the current date, November 26th, 2021. The general look of the chart indicates an uptrend of the hashrate, which means that the hash rate of Ethereum has been increasing over time and the price line of ETH corelates with the mean hash rate line. The hashrate was always below 10 trillion per second since 2014; it was stable below the 10 trillion range as shown in the chart above, where the mean hash line is flat from the beginning. It started to ascend from the beginning of 2017, which means that new miners were joining the network with higher computing power. The uptrend continued into 2018 to reach a peak of over 230 trillion transactions per hash, and it was accompanied by a significant increase in ETH price, rising to over $1000. This shows that ETH mining was gaining momentum in 2017 to 2018.
There was a little decline in the hash rate in the third quarter of 2018 to the first quarter of 2019. This decline in hashrate caused the price of ETH to decline from a high of about $1000 to a low of $92. From there, the hash rate was moving around a sustained range of 140 Trilion to 240 Trilion. With the price of ETH also moving along with a constant price between $100 and $200, The hash rate started increasing steadily since August 2020 and has been up to date.
A sharp but temporal decline occurred around May-June this year as a result of the Chinese band of crypto mining and other external factors. Since then, the hash rate of Ethereum is currently at its peak of around 806 hashes per second and the Ethereum price has reached an all-time high of over $4800. Investors can use the hash rate movement to predict the next movement of the ETH price. As it can be seen above, the price always increases with respect to the hash rate increment.
The current hash rate of ETH on November 26th, 2021 is 789,231,880,552,000/s as seen in the screenshot below;
.png)
ETH hash rate from https://studio.glassnode.com/
4.- Calculate the current Stock to flow model. Explain what should happen in the next Halving with the Stock to Flow. Calculate the Stock to flow model for that date, taking into account that the miners' reward is reduced by half. Show screenshots. Regarding Bitcoin.
The stock to-flow model is used to calculate the rate of production of the most precious assets like gold, bitcoin, and diamonds. With this model, we can calculate the amount of the particular asset that has been produced in the year. The task here is to calculate the current stock-to-flow model of BTC and anticipate this model by the time of the next halving.
Calculating the Stock to Flow Model this Year.
parameters for this calculation.
SF = Stock / Flow
Stock = Quantity in existence
Flow = Annual flow production
Annual Flow = [Reward per block ]× annual block production
Stock to flow model = 0.4 ×(SF )^ 3
According to coinmarketcap.com, the amount of BTC in existence at the time of making this assignment was 18,884,562. As seen in the screenshot below;
6.25BTC as a reward per block
Anual block production = (Total number of blocks to be produced this year) = 52, 560 blocks
Annual Flow = 52,560 blocks multiplied by 6.25
Hence, the flow of BTC this year =328,500 BTC
Flow/Stock =18,884,562/328,500
Hence, stock/flow >>> >> 57.4872511416 ~ 57.5
Finally;
The Stock to Flow Model = 0.4 × (57.5 ) ^ 3
> > > > > 76043.75
Therefore the current value of the Stock to Flow Model=76043.75.
The image below is the Stock to Flow Model chart of BTC on lookintobitcoin.com
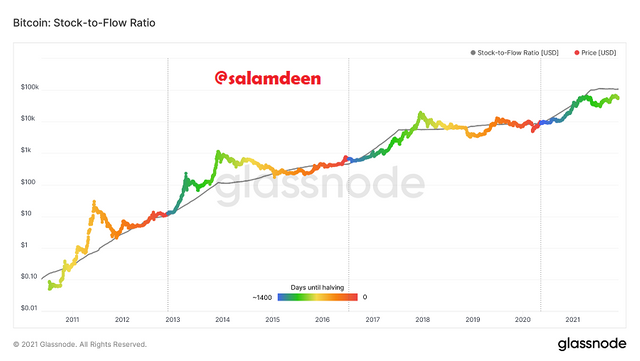
BTC Stock to Flow Model Chart on lookintobitcoin.com
What would happen if the Stock to Flow Model was halved again?
The next halving will occur in 2024, when the rewards received by miners will be cut in half, while the BTC supply will increase by 655,250 as miners continue to earn.
As the current supply of BTC is 18,884,562, we have to add the number of additional BTC by then to get the stock of BTC supply in the next halving
The stock supply in 2024 will be equal to 18,884,562 + 655,250 = 19539812.
Calculate the stock to flow model by the next halving
Stock supply = 19539812
118.963847793 = 19539812/(3.12552560) = 118.963847793
finally, the stock to flow model= 0.4 x 118.963847793 ^ 3 = 673449.444934
Therefore, the stock flow model in 2024 will be 673,449.444934 which is a huge increament from this year's own. From the BTC stock to the flow model chart, we can see a direct uptrend since the first halving. It should continue in this manner to the last halving as new BTC coins keep being added into the system.
Conclusion
Keeping track of all these metric indicators discussed above will help generate more revenue for long-term investors. They are focused on the primary source of the assets and how they are being circulated in the system, which will always give the right signals no matter what. This lecture was quite engaging and I have gained a fair knowledge of some of the key indicators as far as the mining and circulation of proof-of-work-based assets are concerned. Thanks to professor @pelon53 for this impact. Waiting patiently for the next lecture .