Crypto Trading with Moving Average -Steemit Crypto Academy | S6W2 | Homework Post for @shemul21
Good day, Steemians. My response to the homework task by professor @shemul21

Image created with Logo designer app

Explain Your Understanding of Moving Average.
The primary goal of technical analysis is to have a general outlook on the asset's price movement. There are countless indicators being used by traders to analyze the market trend. They all have their functionalities, but none of them is 100% accurate when it comes to forecasting the price. Moving averages are one of the most popular technical indicators as they are used by many analysts.
The main function of moving averages is to filter out the market fluctuations, giving traders a clear view of the market trend. Due to market fluctuations, analyzing the overall market trend with only the price chart will be extremely difficult. Moving averages help traders in so many ways, as they take the average of the price data over a specified time period, which is why they are able to filter out market fluctuations.
The calculation of moving averages is done by taking the total closing prices of the asset in a specified range. For instance, for a moving average of 10 time periods on a 1-hour chart, the closing prices of each candle for the previous 10 hours will be considered and the moving average will be calculated based on the type of moving average being used, as there are different types of moving averages and all have their own formulas for calculation. For a simple moving average, the calculation is done by summing the prices and dividing them by the number of time periods.
Moving averages are very useful to traders in so many ways. By using the moving average, we can simply figure out the direction of the price change. If the right moving average is applied to a price chart, we can get a bullish signal when the price line is above the moving average line. Conversely, it is a bearish signal if the price line is below the moving average line. To reduce risks, it should only be applied in trending markets, i.e, when the price chart is in a bearish or bullish trend, as it usually lags in market ranging markets, i.e., when the price is not in a clear trend.
Moving averages are also used as support and resistance on a trending chart. Support and resistance are levels where there is strong buying and selling. If the price falls to the moving average and bounces back, it is a bullish signal. In the same way, if it rises to the moving average and bounces back, it is a bearish signal. You can consider selling from there, but it is good to always confirm with some strong bearish candle before taking a decision. Moving averages are simple to use, and while they do not predict price, they do assist traders in understanding what is going on.
What Are The Different Types of Moving Average? Differentiate Between Them.
The three types of moving averages include simple, exponential, and weighted moving averages. They all serve the same purpose, but the difference is how they are calculated. The difference in their calculations characterizes how they react to price changes. The three types of MAs are defined below.
The simple moving average
This is the simplest and least reactive of the three types of moving averages. The calculation of the SMA is done by simply summing the closing prices over a period of time and then dividing them by the number of periods. If we want the SMA for a 5-day time period, we take the closing prices of every single day for the past 5 days, add them together, and divide the sum by 5. This is how every single period is calculated and that makes up the simple moving average line as the new average is being counted after the formation of every new candle on the chart. There is no need to calculate them again as a trader as they are already embedded on the trading platforms where you can simply use them.
The formula for calculating the SMA is shown below:
SMA= (n1+n2+n3+...+nn)/N
where
n = number of closing prices
N denotes the total number of time periods.
The exponential moving average (EMA)
The EMA has more force than the SMA, making it more reactive, and thus the signals are more precise than the simple moving average due to how quickly they can react to price fluctuations.With the exponential moving average, smaller weights are added to previous prices gradually as the price changes by the use of the smoothing function. Exponentially, the previous weights will be bigger than the subsequent ones. This is carried on repeatedly as new candles are formed. With regards to reactions to price actions, the EMA reacts to price changes more steadily than the SMA.
The formular for the calculation of EMA
EMA (Current) = (current price(smoothing/1+days)) + EMA (previous) (1-(smoothing/1+days))
Wheighted Moving Average WMA
The weight moving average is one of the types of moving averages. It is also more reactive than the simple moving averages. The calculation of weighted moving averages is done by ascribing different weights to the prices as they change. Here, the weights increase gradually as the price changes; hence, previous prices have lighter weights than subsequent prices.
The calculation of WMA
[(P1W1)+(P2Wn-1)+(Pn)/summation (W)]
Where
W = the weights that have been measured
P stands for price.
Some of the main differences Among the three types of moving averages, which are highlighted below.
| Simple moving average | Exponentail Moving average | Weighted Moving Average |
|---|---|---|
| At each data-point(price) on a SMA, there is equal weight with the previous data-points (price) | Weight reduces exponentially in previous data-points. | Weights increases as price changes |
| The higher the SMA, the stronger the signal | Smaller EMAs have the strongest signals | Both higher and lower WMAs have good signals. |
| More stable when it comes to reacting to price changes and trend shifts | Quick response to price changes,hence trend shifts are signaled faster | Quick response to price changes. |
| Good for long-term trend actions due to its stability | Reliable data for short term trend detection. | Also good for long term trend detection. |
Identify Entry and Exit Points Using Moving Average. (Demonstrate with Screenshots)
The aim of every technical analyst is to make some profit at the end of the day. We can use moving averages to decide if we are selling, buying, or hodling. There are so many ways we can identify and buy positions with moving averages. I have demonstrated this in the illustrations below.
Identifying Entry and Exit Position with Moving averages.
Consider the screenshot of BNB/USDT 4hours chart below
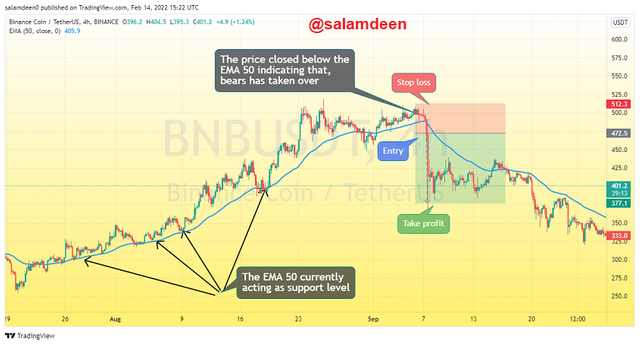
Short position with BNB/USDT chart||Screenshot from tradingview.com
The market has been in a bullish trend since August 20, as seen in the screenshot above, and the EMA 50 line has been acting as a support level for the trend.The trend was reversed when the price line fell below the EMA 50 line. This is an indication that, a support level has been broken, signalling a downtrend.
Entry Position
For this illustration, I used the EMA 50. I set my entry position when the price chart fell below the EMA 50. This was a signal of a bearish trend. The entry was set after the formation of two strong bearish candles as the price fell below the EMA line at the price level of 472.2.
Exit positions
The position I created was a short position, hence the stake profit and stop loss were set with a risk reward ratio of 1:2.5. I set the stop loss a little bit above the previous high where the price broke down. This is now acting as the resistance level.
What do you understand by Crossover? Explain in Your Own Words.
Crossover moving averages are a widely used strategy by analysts. With moving average crossover, we can get strong signals by combing multiple moving averages, and this will further help in setting our entry and exit points. Using a single moving average provides only the trend direction and no strong indication of when the trend will end.Moving average crossover will give us a good outlook on the trend and we can set entry and exit levels with that.
The moving averages cross over strategy employs both short and long time periods. When you use the same type of moving average, say, the exponentail moving average, with different time periods, the shorter time period will be more reactive to price changes than the longer time periods due to the fact that, the longer time period uses more data points from the previous time.
For instance, if you are using the 20 EMA and 100 EMA on a one day chart, the 20 EMA will be using the price data for the past 20 days, whilst the 100 EMA uses price data for the last 100 days. This means that the 20-day EMA will be closer to the price than the 100-day EMA. We can use this as an opportunity to predict the market by taking note of the points where the two MA lines crossover one another.
When the multiple moving averages are applied on the chart, we can observe it to see where they crossover. If the faster moving averages cross the slower one, it is usually a bullish signal. We can buy at this point, but waiting for a bullish candle to confirm the signal before buying is always recommended. In contrast, when the slower moving average crosses the faster one, it is a bearish signal. We can set a sell position if the trend is confirmed.
For instance, if you are using 20 and 100 EMAs, when the 20 EMA crosses the 100 EMA, we can take a buy position at this point, or when the 100 EMA crosses the 20 EMA, we can take a sell position.
It is advisable to use the crossovers only in trending markets, as there are likely to be false signals in a consolidating/ ranging market. That is why most traders prefer to use the crossovers in larger timeframes, as the trend in shorter time frames is not usually clear. However, if the market is in a trend on a shorter timeframe, we can use it for signals.
To use the moving average crossover in tradingview, you can click on indicators and twice click on the Exponentail moving average if you want to use two EMAs. You then go back to the chart and customise the two EMAs to the preferred time. The next thing is to confirm the chart to see if it responds to the crossover. If it does, you can then use it for your analysis.
The screenshot below is an illustration of the moving average crossover with the BTC/USDT chart from tradingview.com, demonstrated with a short and long position, Using the 20 and 100 period EMA
Bullish Trend With Moving Average Cross Over
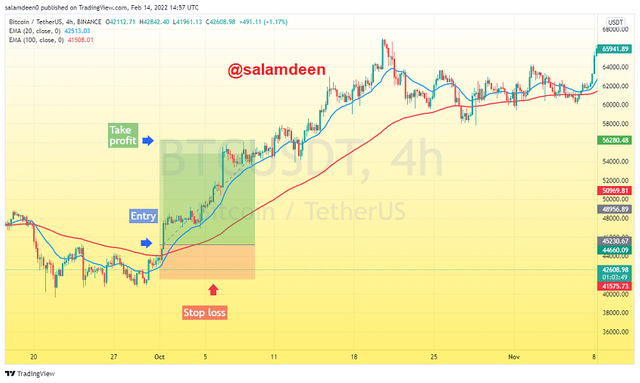
BTC/USDT 4hour chart with bullish signal|| Screenshot from tradingview.com
Bearish Trend with Moving Average Scrossover
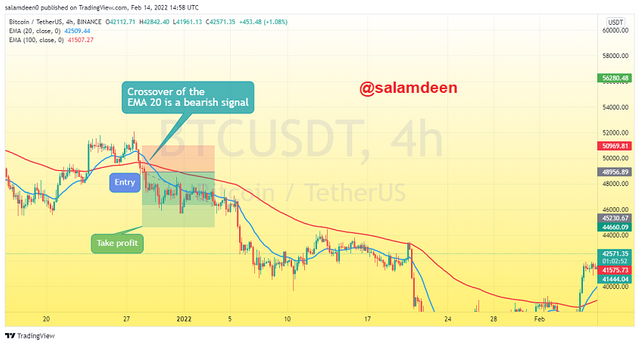
BTC/USDT 4hour chart with bearish signal || Screenshot from tradingview.com
Explain The Limitations of Moving Average
Like I indicated earlier, no indicator is 100% accurate. They all have their drawbacks. Despite the simplicity of the moving averages, there are some limitations, which I have discussed below.
🏴Moving averages only use the average price to indicate trends. Because it does not incorporate any data outside the range of the average price, some of the signals turn out to be lagging due to a lack of more data to handle severe fluctuations.
🏴 Moving averages are only applicable in trending markets. It is only applicable in situations where one of the buyers or sellers is controlling the market. With this, signals from ranging or volatile markets turn out to be false.
🏴If you use a non-effective moving average for your analysis, you can easily be misguided into trading with false signals, which will lead to losses.
🏴The fact that, moving averages use more of the previous data increases the chances of false signals, especially if there is a significant change in the price of the asset. Technically, the price of the asset could change to something different from what it was in the past. For instance, if an asset rises 10x, depending on the previous data as in SMA may result in wrong signals due to the significant change in price.
As seen in the SLP/USDT 15 mins chart below, the market is in consolidation, hence, it will be difficult to spot a trend with Moving averages
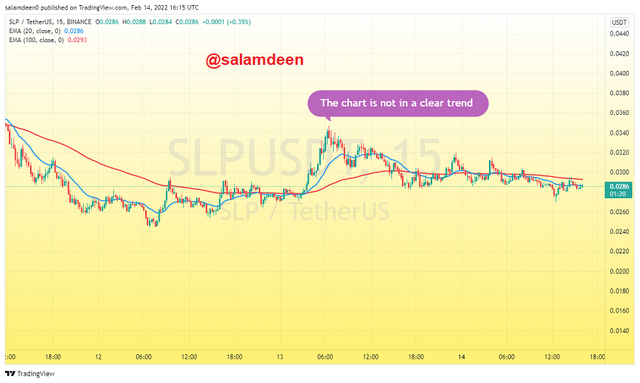
SLP/USDT 15minutes chart in consolidation || Screenshot from tradingview.com
Conclusion
Identifying the trend is the most important thing for technical analysts because if you are able to know where the market is headed towards, On the other hand, if the signal of the trend is an uptrend, you can enter a buy or long position. On the other hand, if it is a downtrend, you can sell or enter a short position.
With moving averages, identifying the trend is easy because it tracks the price of the asset. However, the right moving average must be used at the right time because, if you use the wrong moving average, you may end up getting the wrong signals. As it is said that none of the technical analysis tools is 100% accurate, so are the moving averages, but if they are used the right way with other indicators like the stoichastic and SRI, the win rate will always be high.
This lecture is very helpful and I have learnt more about moving averages in a simple way. It is always good to consider the risk involved before venturing into any trade, as the crypto market is mostly volatile. I can't wait to participate in the continuation of his lecture.
All thanks to professor @shemul12 for this lecture.