Crypto Academy Week 16- Homework Task for Professor @Kouba01| Bollinger Bands|
Hellow Everyone,
I am much grateful participating in this week homework post for prof @kouba01. The detailed lesson on Bollinger Bands trading was very comprehensive.
All my chart graphs are taken from Trading View
Bollinger Bands
Bollinger band as stated by prof @kouba01 was develop by famous John Bollinger in the year 1980s. in simple terms, it is a technical indicator which is used to measure price volatility. As RSI indicator does in determining oversold and overbought of an asset, Bollinger band act as an oscillator to determine an overbought and oversold of an asset.
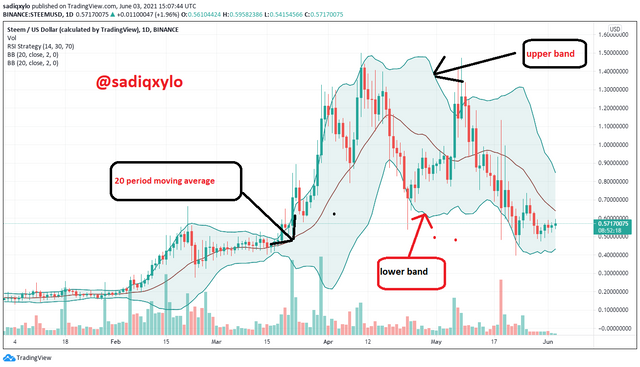
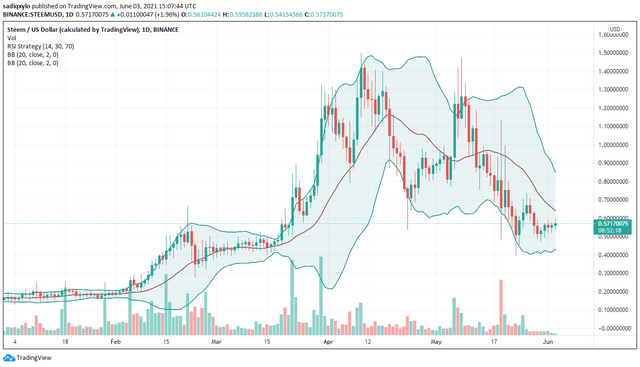
Bollinger band composed of three different lines, the first line being the upper band, the middle line being the simple moving average (SMA) and the lower line being the lower band. the upper band is plotted plus two standard deviations (+ 2 SD) above the simple moving average and the lower line is plotted at minus 2 standard deviations - 2 SD), this is done with a period of 20 by default. This default setting can be changed to suit the trading style of the trader, for instance, a trader can decide to use a period of 10 moving average (SMA) and in that case the lower band will be plotted at minus 1.5 standard deviation and the upper band will be plotted at plus 1.5 standard deviation for a short trading style. For a long trading style, a trader can decide to use a period of 50 moving average (SMA) and in that case the lower band will be plotted at minus 2.5 standard deviation and the upper band will be plotted at plus 2.5 standard deviation. The representation of the Bollinger band can be shown in the chart below.
Calculation of Bollinger Bands
The two parameters to consider when calculating for Bollinger band are; Standard deviation and moving average. Moving Average can simply be the average closing price of an asset for a selected period of time while the standard deviation measures how far price is from an actual average value. This average value is referring to the moving average.
For this homework post I will be calculating for the 20 period of the moving average, and so the upper band of the Bollinger band is calculated by adding 2 standard deviations to the moving average while the lower band is calculated by subtracting 2 standard deviations from the moving average. Below represents the mathematical expression of what I explained.
Moving Average (MA): Sum of prices over * days/number of days
Upper band: 2 standard deviation + MA
Lower band: 2 standard deviation – MA
Usually a trader doesn’t need to go through all these calculations, since almost all the trading platforms provides Bollinger band.
How Bollinger Band Works
Bollinger band can be use in so many ways and some include, price volatility, overbought and oversold, price breakout and so on. Some of these will be discuss below.
Volatility
Bollinger band expresses price volatility in much simpler way and very easy to understand. The wider the upper band and lower band from each other the greater market volatility of an asset and also the closer the upper band and lower band to each other the lesser the market volatility of an asset.
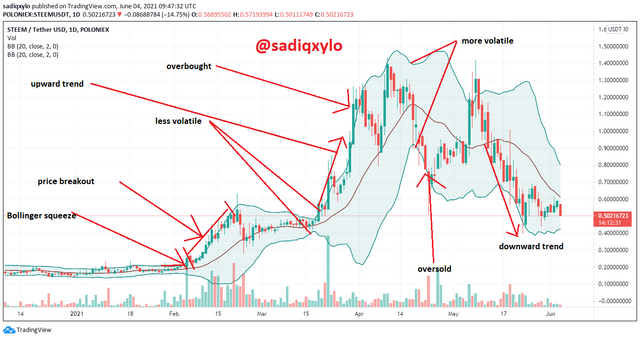
As seen on the chart above, within 15th of March the Bollinger band was closer and brought about less volatility in the price chart of steem (0.40 – 0.50). from April 20th there about the Bollinger band was wider and brought about great volatility in the price chart of steem (0.06 – 1.4).
Overbought and Oversold
When the price of an asset is extremely increasing it can be term as an overbought, this is indicated by a Bollinger band when the price chart touches the upper band. At this point traders can place themselves in a sell position to gain profit from the market.
Also, when an asset price is extremely decreasing it can be term as an oversold and it is indicated by the Bollinger band when the price chart touches the lower band. At this point traders can place themselves in a buy position to attain more of the asset.
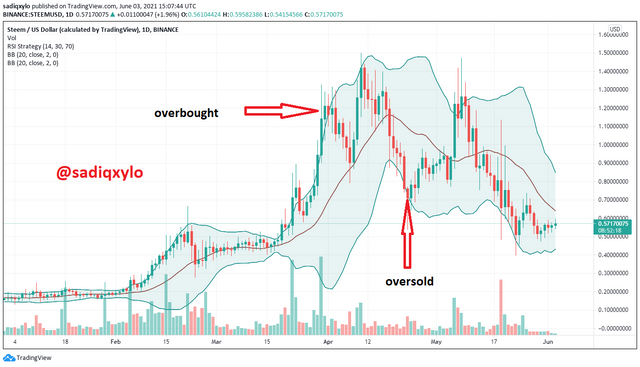
As seen on the steem price chart above, the price chart touches the upper Bollinger band somewhere April 5th, traders place themselves in a sell position, which eventually leads to the gradual decrease in the price value of steem the following days. Also, around 20th May, when the price chart touches the lower band, traders placed themselves in buy position which eventually leads into the gradual increase in the price of steem the days after.
Bollinger Band Setup
To setup a Bollinger band on a price chart, I will be using trading view to demonstrate this.
- You first need to visit the tradingview site.
- Click on fx as sometimes indicated as indicators and strategy.
- Search for Bollinger band from the search box and select “Bollinger band”
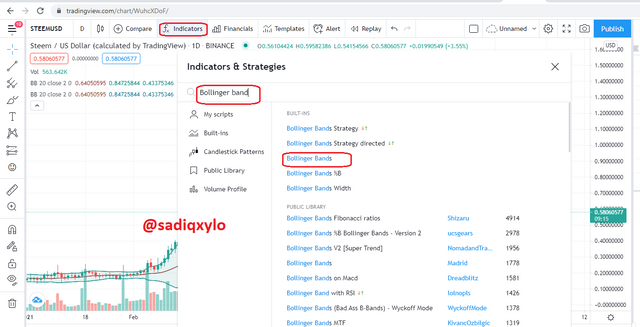
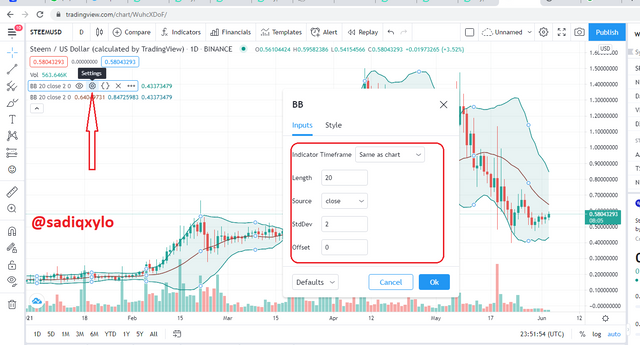
It can be seen from the chart below how Bollinger bands appear on a price chart.
To change the default setting to suit your trading style, you can simply click on the Bollinger band settings which shows the various options like standard deviation, source, length, offset and close. All these can be altered to suit the traders' trading style.
What is a breakout and how do you determine it? (Screenshot required)
Breakout of an asset is simply the movement of the asset price chart be young a predetermined support or resistance level. This may vary from traders to trader since every trader marks his/her support and resistance level.
Determining Breakout with Bollinger Bands
Bollinger bands can be use t determine price breakout of an asset, this I done by looking for a Bollinger squeeze. At this squeeze, the upper band and the lower band narrows the moving average. At the point of the squeeze the price volatility of the asset becomes lesser and afterwards rise to a breakout. Price breakout usually follows a squeeze in Bollinger band making it a key factor.
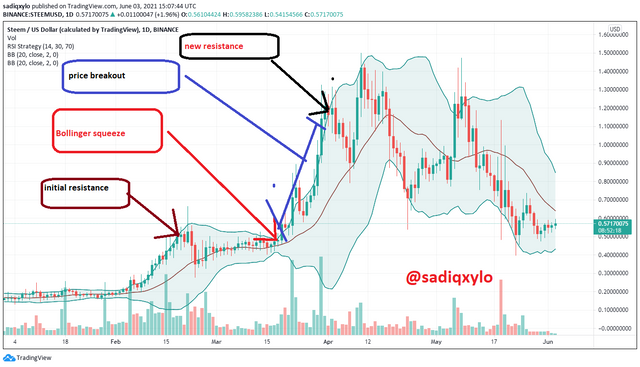
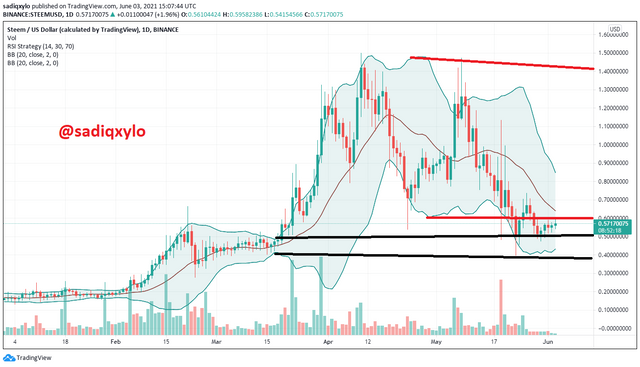
From the screenshot above, it can be seen that the initial resistance of steem was at $0.40 as at 20th February there about and it was the first breakout of steem. This is followed by a Bollinger squeeze in middle of March making the price volatility lesser, afterwards, a massive rise in the price of steem from middle of March to early April and attain another breakout of steem at $1.10, which form a new resistance.
How to use Bollinger bands with a trending market? (screenshot required)
Bullish Trend
For bullish trend, when the price chart hit the moving average and form a support, the price chart tries to move away from the moving average towards the upper band showing an upward trend. In all cases the Bollinger band moves in upward trend. At this point traders placed themselves in a buy position.
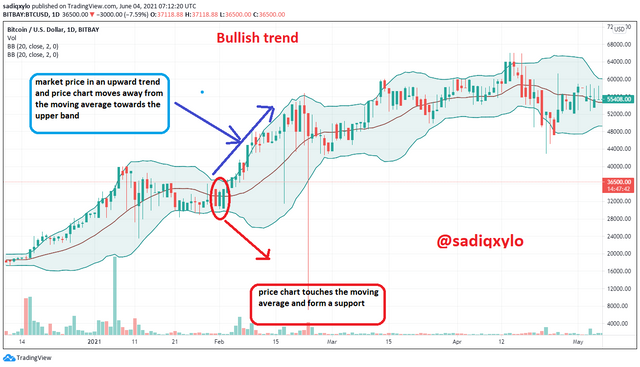
As seen on the BTCUSD price chart, the chart hits the moving average on early February with a price of $32,000.00 and form a support. The chart then moves away from the Moving average towards the upper band which brought about increase in the chart graph and increase in price value from $32,000.00 to $52,000.00 on 23rd March there about.
Bearish Trend
For bearish trend, when the price chart hit the moving average and form a resistance, the price chart tries to move away from the moving average towards the lower band showing a downward trend. In all cases the Bollinger band moves in downward trend. At this point traders placed themselves in a sell position.
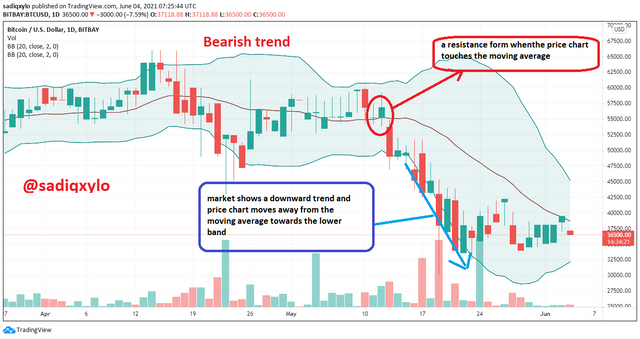
As seen on the BTCUSD price chart, the chart hits the moving average on 13th of May with a price of $55,000.00 and form a resistance. The chart then moves away from the Moving average towards the lower band which brought about decrease in the chart graph and decrease in price value from $55,000.00 to $32,500.00 on 23rd May.
What is the best indicator to use with Bollinger Bands to make your trade more meaningful? (Screenshot required)
To be sure of your analysis, you need to combine Bollinger bands with different indicator to see if it all gives the same reading. Left on to me, I will choose the RSI indicator as best indicator to use with Bollinger bands. RSI indicator determines overbought and oversold by using average closing and opening price of an asset. When the RSI indicator reads below the 30 mark an asset is considered as an oversold, likewise when reads above 70 mark it is considered as an overbought.
The upper and lower bands of the Bollinger banger band serve as the boundaries for oversold and overbought. When a chart touches the upper band it is considered as an overbought and when a chart touches the lower band it is considered as an oversold. When these two indicators are used together, it will bring about some certainty in a trader’s analysis.
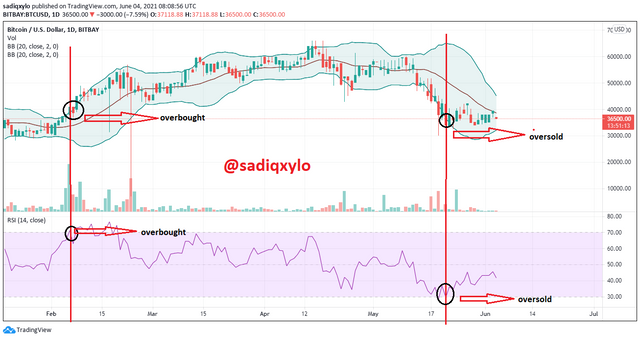
Considering the BTCUSD chart above, both Bollinger band and RSI indicator are used in determining an overbought and oversold of BTC. On the 7th of February there was an overbought in the price of BTC and as indicated by both indicators. The chart touches the upper band of the Bollinger band and at same period the RSI indicator also reads over the 70th mark.
On the 20th of May too, an oversold occur in which the RSI indicator reads below the 30th mark and the Bollinger band to was touched at the lower band by the price chart.
When both oversold and overbought occurs, the price chart moves in opposite direction putting traders in right position to make profit.
What timeframe does the Bollinger Bands work best on?And why?
The Bollinger band suits every trading style. For short time trader who visits and leaves the market within minus, hours and a day can employ the 10 period moving average in their analysis. In that case their lower and upper bands will be plotted at minus 1.5 and plus 1.5 standard deviation respectively. For moderate trader like days and weeks can employ the 20 period moving average in their analysis and have their lower and upper bands plotted at minus 2 and plus 2 standard deviations respectively. For long time traders like months and years can employ the 50 period moving average in their analysis and have their lower and upper bands plotted at minus 2.5 and plus 2.5 standard deviations respectively.
In all these cases, the Bollinger band provides a suitable time period for each trading style.
Review the chart of any pair and present the various signals giving by the indicator Bollinger Bands. (Screenshot required)
All that I will discuss here have already been explain in the previous questions above but i will use the STEEMUSD chart graph to enlighting more into it.
Review of STEEM/USD chart using Bollinger bands Indicator
Overbought and Oversold
From the steem chart above, an overbought can be seen in early April, where the graph chart touches the upper band and in tern changes direction. Also, an oversold can be seen in late April where the chart hits the lower band and moved in the opposite direction.
Price Breakout
The key factor in determining a price break out in Bollinger band is finding a bollinger squeeze, and from the chart right after the Bollinger squeeze, the price of steen increase extremely to form a new resistance. this breaks the initial resistance of $0.20 and attain a new resistance of $0.50.
Volatility
On the chart graph the leeser volatility is brought about by the narrow of the lower and upper bands to the moving average which creats a lesser price range of $0.30 - 0.50. Also, the more volatility is brought by the wider of the lower and upper bands from the moving average which creates a greater price range of $0.90 - $1.40.
Market Trend
As seen on the chart graph above, when ever the bollinger band moves upwards, the market trend does same, and vise versa.
Upward trend: the Bollinger band moves upward which creats an upward trend in the market and the steem chart graph moves from the moving average towards the upper band creating a buy position of steem for traders. As indicated by the upward trend, the price of steem rose from $0.50 to $1.10.
Downward trend: the Bollinger band moves downward which creats downward trend in the market and the steem chart graph moves from the moving average towards the lower band creating a sell position of steem for traders. As indicated by the downward trend, the price of steem decease from $0.90 to $0.40
CONCLUSIN
The bollinger band indicator combines both RSI and the MACD indicators in its operation, this is becouse, the Bollinger can be use to determine oversold and overbought as done by the RSI indicator. Also, the Bollinger band can be use to determine the market trend of an asset as done by the MACD indicator.
Though the Bollinger band does the work of both RSI and MACD, trader should still make a point to pair these indicators to get a better result when analysing.
Thanks For Your Attention
Hello @sadiqxylo,
Thank you for participating in the 8th Week Crypto Course in its second season and for your efforts to complete the suggested tasks, you deserve a 9/10 rating, according to the following scale:
My review :
Excellent work, through which you analyzed all the required elements in the questions well and with a clear methodology. The question remains, the best settings for the indicator did not provide what should be presented.
Thanks again for your effort, and we look forward to reading your next work.
Sincerely,@kouba01
Thank you both for helping me understand the Bollinger bands.