Crypto Academy / Season 3 / Week 8 - Intermediate: Crypto Assets and the Random Index (KDJ)
Hellow Everyone,
I am much grateful participating in this week homework post by Prof @asaj. The detail lesson on Crypto Assets and the Random Index (KDJ) was very comprehensive. Below are my opinion on the questions asked in the lesson.
What Is The Random Index?
The Random Index is a technical indicator that was developed in the late 1950s by crypto enthusiast George Lane. Random Index has been a good indicator in in analysing and predicting the changes in asset trend over a certain period of time. To add on, the Random Index help traders to identify trend reversal, entry and exit points in the market, overbought and oversold and many other signals.
The Random Index is much similar to the Stochastic Indicator which consist of two different lines but with the Random Index, there is an additional like called the J-line. The J-line identifies the divergence of the D-line from the K-line. The D-line and K-line as function in the Stochastic indicator are for depicting oversold and overbought respectively, hence, these two lines are for entry and exit points or buy and sell positions.
The Random Index consisting of these three lines D-line, K-line and J-line gave it the name KDJ Indicator which is used for determining asset trend, overbought and oversold, buy and sell positions etc.
How to calculate RANDOM INDEX
To calculate for the Random Index value we need to first find the Reserve Value (RSV) in the given period. And with the RSV value for the given period we have find the Highest, lowest, and closing prices of a certain period of the underlying asset 'x'.
Highest Price of a certain period, Hx
Lowest Price of a certain period, Lx
Closing Price of a certain period, Cx
The RSV value ranges between 1 - 100 and is calculated using the formula below.
RSV of the given period = (Cx-Lx)/ (Hx-Lx) X 100
Now that we have our RSV value for given period, we need to obtain the K value of the given period, D value of the given period and J value as well. 50 is estimated for the K and D values if in case we can’t fine the values for the previous day.
K value = (2/3 x K value of the previous day) + (1/3 x RSV value of the day).
D value = (2/3 x D value of the previous day) + (1/3 x K value of the day).
J value = 3 x K value of the day - 2 x D value of the day
The indicator lies between 0- 100 in the price chart and from 20 below indicates and oversold, also 80 and above indicates an overbought. The KDJ indicator is good for the Scalping trading style.
Is the random index reliable? Explain
For every trader, the set goal is to determine the trend of his/her underlying asset. As the saying goes, the trend is your friend and if you trade against the trend, you will make a big loss. To stay away from making a big loss, we need not to deeply rely on KDJ or any other indicator solely.
The KDJ indicator is good for short term trade but with a long term or a neutral trend, it always gives false signals as a result of its inability show visible trend.
No indicator is 100% perfect and so to get near accurate results, traders should employ several indicators on a single chart to filter out false signal. For instance, the KDJ indicator can be combine with the Bollinger bands or the RSI to compare output signals.
Adding Random Index To A Chart.
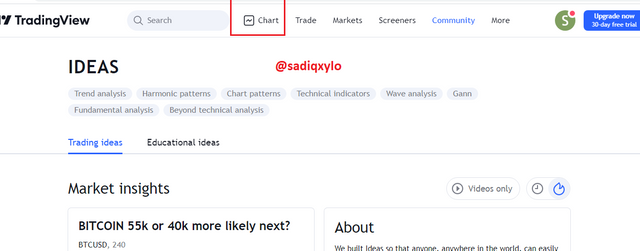
- First of all, we need to visit the official site of the tradingview and click on Chart.
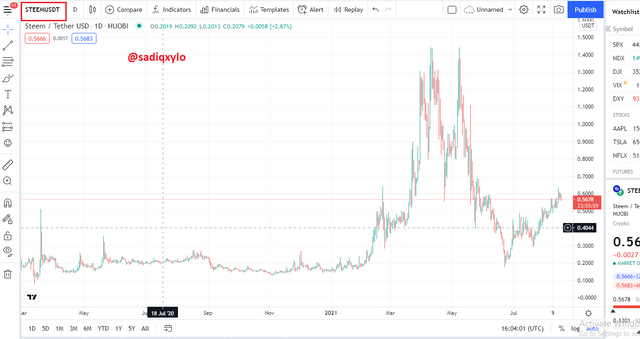
- Select any crypto pair you wish to study. For the purpose of this task, I will select STEEM/USDT.
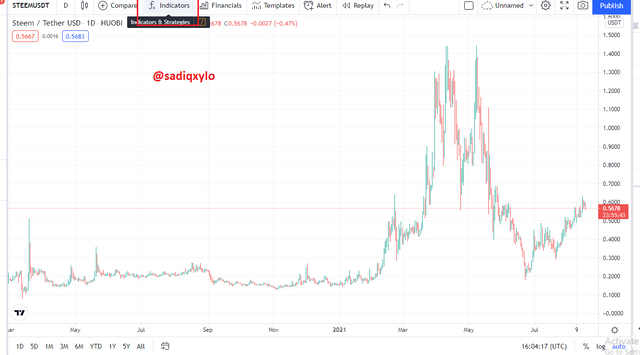
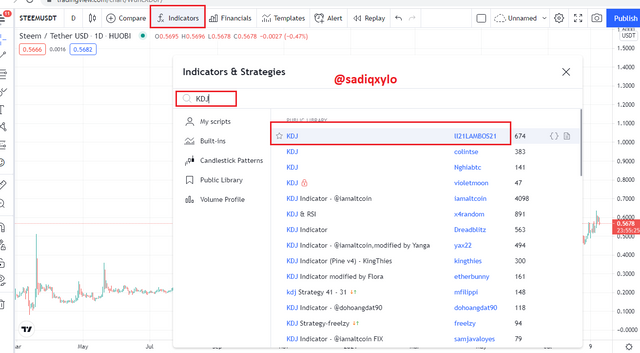
- Click on the fx (indicator and Strategy tab at the top part of the window.
- In the Search box type KDJ and click on KDJ by LL21LAMBOS21.
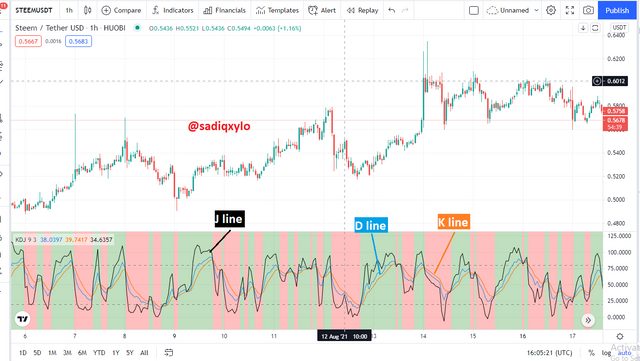
- The KDJ indicator is added to the chart with each line having a distinct colour. K line is usually blue, D orange a J line black.
Parameters Of The Random Index
Overbought Signal
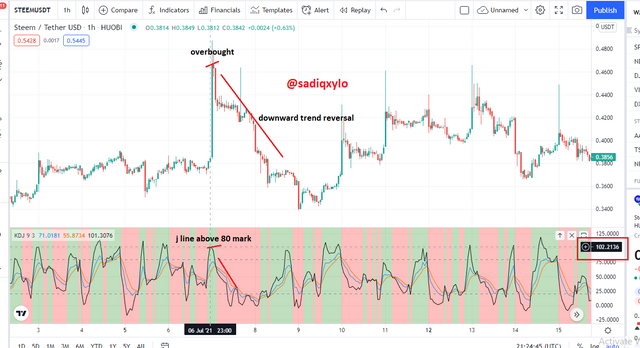
The KDJ indicator depict an overbought by the J - line plotted above the 80 mark in the price chart. When the J - line moves above the 80 mark, it’s indicated by the KDJ indicator as an oversold region. Overbought usually follow by a downward trend reversal, this is due to traders marking a lot of profit and decide to exit the market.
From the STEEM/USDT chart above, as the J - line move above the 80 mark, the initial trend of Steem move greatly upwards and form an overbought region, which is followed by a downward trend reversal due to traders exiting the market after making enough profit.
Oversold Signal
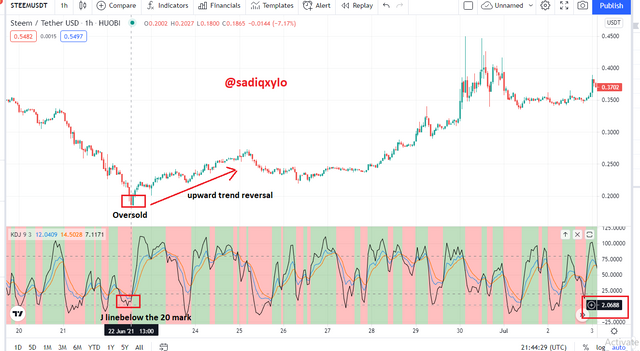
This is indicated by the J - line plotted below the 20 mark. An oversold usually occur as a result of great number of traders exiting the market and is usually followed by an upward trend reversal as the indicator marks an entry points for traders and asset is bought at the lowest price.
.png)
Again, from the STEEM/USDT chart graph, an oversold region is signal as the J - line move below the 20 mark. This creates an entry point for traders as the asset will be bought at the lowest price.
Uptrend Signal
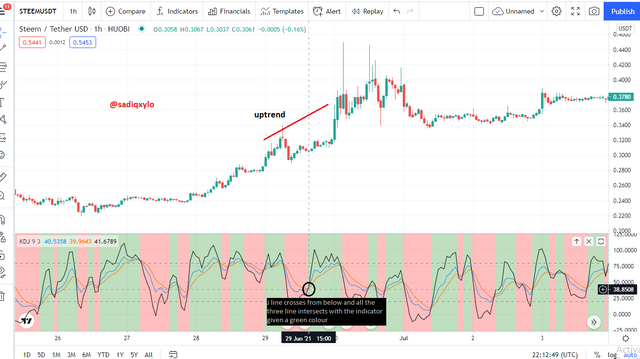
Uptrend signal is given by the KDJ indicator when the J - line crosses over the D - line and the K - line from below upwards, at this point all the three line intersect and the initial downward trend of the asset will take reversal to an upward trend. The indicator gives a green colour for an upward trend.
Downtrend Signal
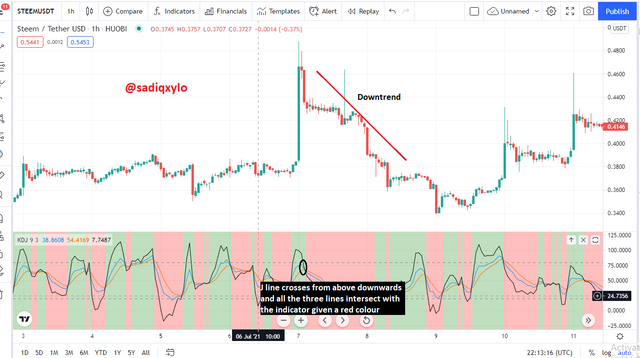
Downtrend signal is given by the KDJ indicator when the J - line crosses over the D - line and the K - line from above downwards, at this point all the three line intersect and the initial upward trend of the asset will take reversal to a downward trend. The indicator gives a red colour for a downward trend.
Dead Fork Signal
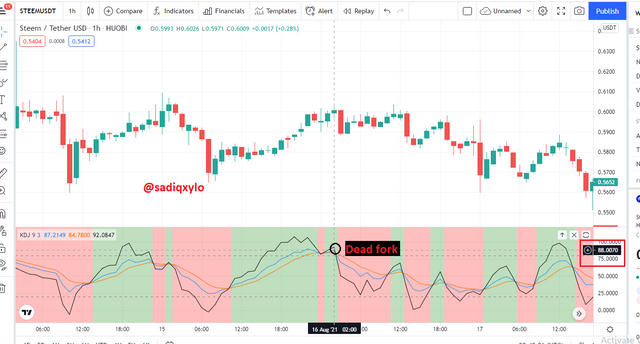
This signal is similar to the downtrend but in the Dead Fork, the J line all the line intersects above the 80 mark and the J - line crosses the other two lines from above downwards. This mark a sell position and traders should prepare to exit the market.
Golden Fork Signal
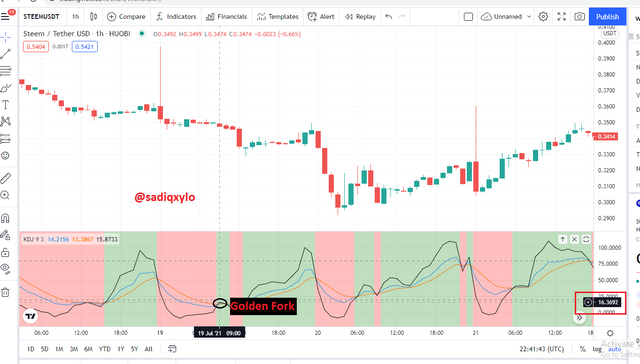
This is also similar to the uptrend but with the Golden Fork, the intersection of the three lines occur below the 20 mark and the J - line crosses the other two lines from below upwards. This mark a buy position and traders should prepare to enter the market.
Differences Between KDJ, ADX, and ATR.
KDJ indicator
The KDJ indicator as mention above, is to identify market trend, overbought and oversold, buy and sell signal, hence, entry and exit points. This is achieved by the movement of the K, D and J line and the crossover of these lines.ADX
The ADX indicator determines the strength of an asset trend, its non-directional, meaning it doesn’t determine the direction of an asset trend. With the help of the directional lines of the ADX, that is, +DI and -DI, the indicator will be able to determine the direction of an asset trend. The ADX line is plotted with values of 0 to 100, the quantification has subdivisions based on varying degree of strength of trend, as given below.
| ADX VALUE | STRENGTH OF TREND |
|---|---|
| 0 - 25 | No trend |
| 25 - 50 | Strong |
| 50 - 75 | very strong |
| 75 - 100 | extremely strong |
- ATR indicator.
The ATR ( Average True Range) indicator determines the volatility of an asset, how great an asset has fallen or risen in given period of time with reference to a certain price.
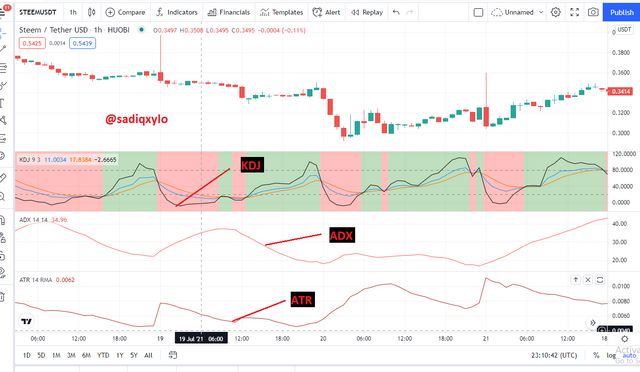
** How the three indicators appears on a single chart**
Some Key Differences between KDJ, ADX and ATR
| KDJ | ADX | ATR |
|---|---|---|
| Consist of three different line | Consist of one line but can employ the +DI and -DI lines | Consist of single line |
| Depicts market trend, overbought and oversold, buy and sell positions | Determines strength of market trend | determines market volatility of an asset |
| Reference level is the 20 and 80 mark | reference level is the 25 mark | Default period is 14 but 10 is the best range period |
| Directional | Non-directional | Non-directional |
| 50 is assumed as the K and D value for the previous day | 14 as default period and length | 14 as default period |
Using The Signals Of The Random Index To Buy And Sell Any Two Cryptocurrencies.
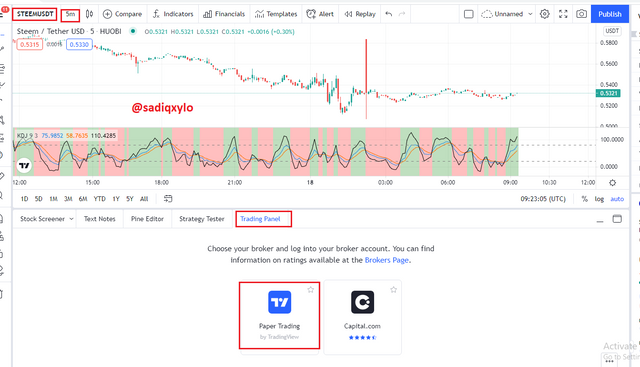
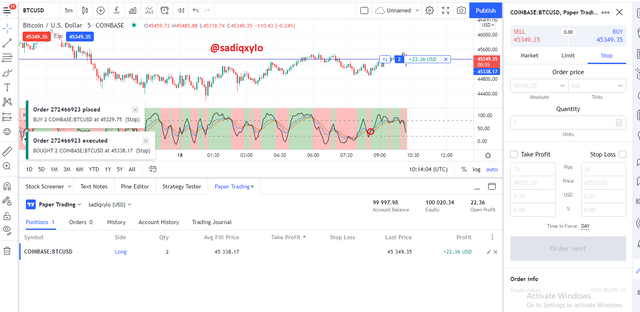
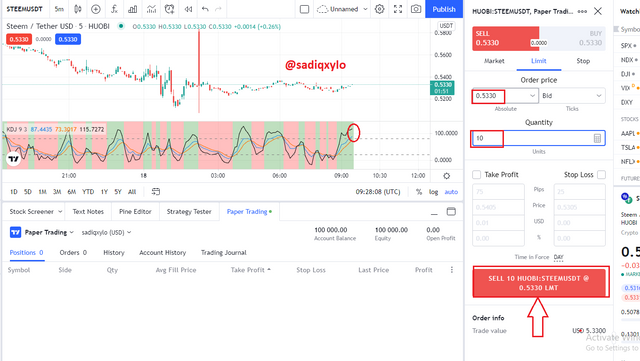
- STEEM/USD Chart was selected with 5 minute time period. I then clicked on Trading Panel
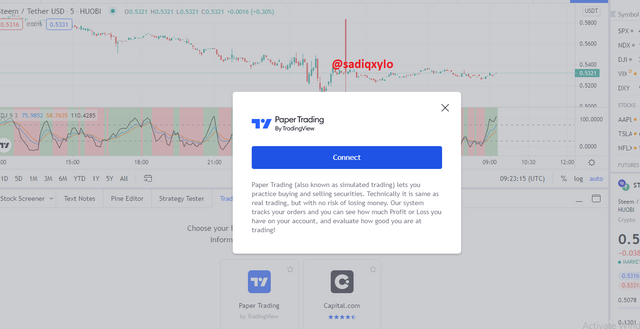
- Next, I connected my account to Paper Trading, which is a Demo Account.
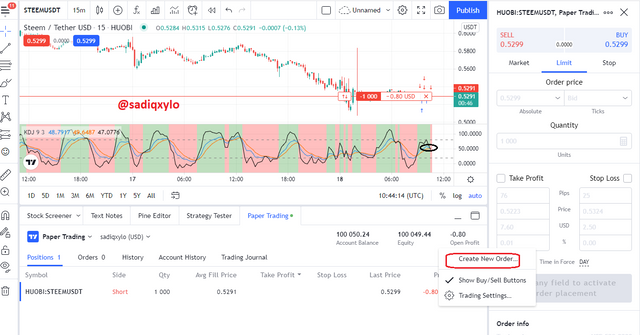
- I placed a sell order because the J line crosses the other two lines from above downwards with all the lines intersecting at a point. The KDJ gave a sell signal.
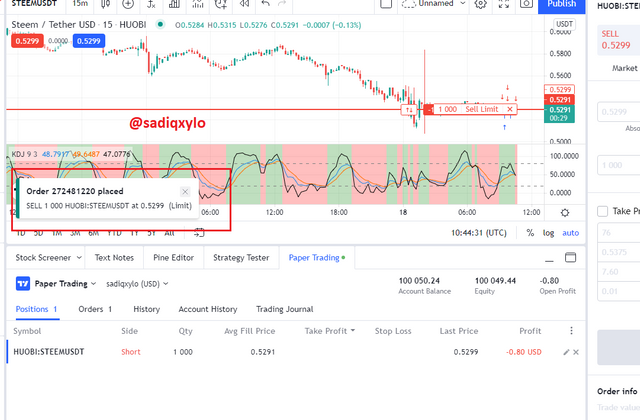
- The order was successfully placed
- I waited for some minutes and the closed the order, but I didn’t make any profit.
The next Crypto pair was BTC/USD, also with 5 minute time period.
- I Bought BTC/USD because the J Line intersect with the other two lines from below upwards indicating an upward trend. Buying at a point of uptrend will usually give a small profit. The order was successfully placed.
- After some time, I closed the order and make a profit of +52.00.
CONCLUSION
The Random Index also known as the KDJ indicator is used to determine the trend of an asset, overbought and oversold and also mark entry and exit positions as the indicator gives a signal of trend reversal. All these are possible because of the three lines in consist of.
No indicator is perfect so we shouldn’t rely mainly on the KDJ indicator, we can combine KDJ with ADR and ART for better result.
The reference line of the indicator is the J - line, when it crosses the other two line from below upwards indicates a buy signal, also, when it crosses the other two lines from above downwards indicates a sell signal.
Thanks For Your Attention
.png)
.png)
.png)
.png)
.png)
.png)
.png)
.png)
.png)
.png)
.png)
.png)
.png)
.png)
.png)
.png)
.png)
Post from last week has not been curated @steemcurator02
https://steemit.com/hive-108451/@sadiqxylo/crypto-academy-season-3-week-7-homework-post-for-professor-yousafharoonkhan