Steemit Crypto Academy - Season 2, Week 6 / Elliott Wave Theory - Elliott Wave Theory / for @fendit
Hello everyone! This week lecture is also so informative and interesting as always. This lecture pout the concept of Elliot Waves in our mind. After a bit research and reading the @fendit 's lecture thoroughly, i understand this concept clearly. Now I am going to do my homework task.
.png)

1. What is the application of this theory?
As we all know that crypto market is versatile. The market keeps going up or down every minute. Changes occur in any assets's value any time. So we should be very clear about our entry and exit spot from market. We should have proper knowledge about the market uptrend and downtrend and when we should invest or withdraw assets from market. A lot of methods are there to predict any crypto assets future. Although, this prediction is not always correct but atleast we get an idea what is going to be happen with that asset in future. Whether it will goes up or down.
.png)
Elliot Wave theory is actually a principle which is used by many expert traders. The traders used this theory to predict the future of the market. The impulsive and corrective waves are used to predict the future trend of the coin. It help us to determine the entry and exit spot of market. The traders get an idea about the coin's future and they decide whether they should invest their assets in that coin or not. This theory shows the market in bi direction. It shows the downtrend and uptrend of market and help the trader to decide when to trade to get higher profit. We get a clear idea of when to invest in market crypto currency to get good in return.
Before investing in any coin, we should consider the three corrective waves and five impulsive waves. The impulsive waves are marked as 1,2,..5 and the corrective waves are marked as a,b,c.
Bullish Trend
.png)
There are total 8 waves in Elliot Theory. First five waves follow the flow of market and last three are consider the Corrective waves. The above screen short shows the Bullish trend. It mean that the market goes up. The bullish trend shows the rise in the market.
Bearish Trend
.png)
The above screen short shows the bearish trend of the market. The bearish trend is when the market goes down. When the price of any crypto currency fall, it is refer as the bearish trend.
| Bullish | Bearish |
|---|---|
| The Elliot waves which shows the Bullish trend are marked as 1,2,....,5 | The Elliot waves which shows the bearish trend are marked as a,b,c. |
| Shows the uptrend of market. It specify the rise in market price | Specify the downtrend of market. Its show the fall in market price. |
2. What are impulse and corrective waves? How can you identify them?
Elliot theory cycle is completed by 8 waves. Some are impulsive and some are corrective waves.
There are total five impulsive waves in Elliot Theory which are marked as 1,2,3,4,5. Each layer has specific characteristics and feature and they shows the market uptrend or downtrend. Each layer has a specific entry and exit point. They define when to enter in market to invest and when to exit from the market to get good profit. The impulsive waves actually are the large moves in the price of any crypto asset. In the following screen short, The 1,3,5 are showing the uptrend of market and 2,4 are downtrend.
Impulsive Waves
_LI.jpg)
Source
There are total five impulsive waves in the Elliot Theory.
First wave: This is the first wave of elliot cycle. The price of any asset in this cycle is very low. The investor invest their money to buy coins. As price is low so more investor buy the coins. So the market price of this start rising.
Second Wave: In second wave, the investors sell their coins when they notice a profit in return of their investment. They sell their assets so market fall down. The downtrend of market start over there. The price again fall so again a good chance to buy the coin again in low price for people who did not buy the coin in first wave. So people again buy the coin at that low price and again the market start ricing.
Third wave: It is the largest market move in the Elliot wave cycle. The bet time to invest money for trader is the starting of the third wave. The investors invest their money at starting of third wave and buy the coin at low price. They sell their invested assets at the end of this wave when the price is high. So they get food profit.
Fourth Wave: As the investor withdraw their investments at the end of third wave, so now again a fall start. The market price again start falling.
Fifth Wave: The price again start rising. Market uptrend again start over there. But it is a big lose to but the coin at that point as compare to the wave 1. Because no doubt that the price is low, but it still very much high as compare to the price of coin at the wave 1. So it is a lose for trader who invest to buy coin at that time.
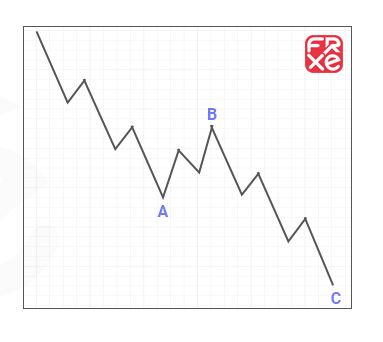
Corrective waves.
There are total three corrective waves in the Elliot wave theory. The correction waves are started after the impulsive waves ended. These waves are marked as a,b,c. The correction waves are actually the correction in Elliot cycle with big differences instead of trends(Impulsive waves). The wave a and c shows the main corrective trends. B is also a corrective wave but the downtrend of market.
_LI.jpg)
Source
These waves also predict the future of market. When the impulsive waves are showing the uptrend of market price, the corrective waves are opposite to that. These are downtrend. When the impulsive waves shows the downtrend of market, the corrective waves shows the uptrend then. The correction waves are grouped as zigzag, triangle and flat.
Zigzag: This correction form is very common and popular in market. In this type of cycle, the changes in wave B will be smaller than wave A and C. The length of these three waves will not same. The price at this wave is rise a little bit. As the price rise so the selling ratio get high as compare to purchase. So again the market downtrend start. It is easy to understand.
Triangle: These waves are close and difficult to spot. They shows the downtrend of market. This type of waves are hard to interpret. .png)
Flat: All the three waves have same length. this type of waves can be identified easily.
What is your opinion about this theory? Why?
This theory is actually a blessing for traders. The investors can determine the entry and exit point of market. We can identify when to enter in market and when to exit from market. The market up and down trends can be spotted to get the high profit and to save from any lose. It help to analyze the behavior of market. After Elliot wave theory, the investors came to know when to buy the coins and when to sell the coins.
This theory is being used by investors for couple of years an investors are getting profit every time when they analyze the market by using this theory. It shows the market behavior with higher accuracy. It is very easy to understand . You don't need o stuck your self in the complexities of graph. You just need to have the knowledge about just two waves used in Elliot cycle and can predict the market future easily.
B) Choose a currency and on its chart, indicate where the full cycle of the impulse and correction waves is located. Explain in detail what you see. You must include screenshots and name which currency you are analyzing
.png) Source
Source
I m going to explain the Elliot Theory with the above Graph. The above graph is combination of impulsive and corrective waves. There are total 5 impulsive and three corrective waves in above graph. It help us us to determine when to enter in market and when to exit from market.
It can be seen from above graph that the price of the coin start rising from start of the March, 2021. The market started rising and it was the beginning of wave 1. The market was at its uptrend. The investors invest their money in coin. They purchase the coin at low price at the start of march. It continuously rised till 15 of march. At the mid of March, the investors start selling their invested coins and get good profit. So the market start falling again.
The price start falling and the waves 2 was begin. The investors again buy the coin as the price again fall down. So again the market start rising from the starting of april. The market uptrend start again. The price rise again. The market rise again and the wave 3 start at there. After a week, the price rise up and investors sold their invested assets to get profit. So again the market fall down because the investors withdraw their investment. The wave 4 start there. The market fall down continuously till mid of April. The investors buy the coin at low price at that time. So as investment level increase the market started rising again. And wave 5 started there. At the Mid of April, the Elliot Theory closed and the Corrective waves appeared. Where A shows the Bearish of market, At B the market goes up and at the end, wave C Again spot the bearish point. In this way, the cycle of Elliot Theory competed.
Conclusion
As we know the in crypto world, there are the chances of profit and loss too. You can lose your money or get the good profit in return of your investment. But the good investors always do the technical analyzes to predict the future of market before investment. It clear the entry and exit spot of market. You get to know when to invest and when to sell your investment. The Elliot Theory is a principle which also helps you to analyze the market. You get to know the behavior and the future of crypto market. One can increase his profit ratio and decreasing the risk level in crypto world by using this theory. It not always shows you the 100% accuracy but you at least get an idea of market future and predict the assets price which helps you a lot in taking investment decision.
I am thankful to the @fendit for this outclass lecture. I hope that i have answered all the questions. THANKS AND REGARD
Cc:
@fendit
@steemitblog
@ steemcurator01
@ steemcurator02
@darwinking
Thank you for being part of my lecture and completing the task!
My comments:
Your work was fine, but all paragraphs seem as if they were separated sentences with little conection in between... that's why I'm not that sure if you completelly got the main concepts of the lecture.
As well as that, when you analyzed the chart in the second task, despite the fact that you correctly marked the pattern, there was no analysis there. Or if it was, it was way too shallow.
Make sure you understand the concepts before submitting your work!
Overall score:
5/10