[Leverage With Derivatives Trading Using 5 Min Chart]-Steemit Crypto Academy | S6W1 | Homework Post for @reddileep
Hello everyone!
I will be presenting the homework task given by professor @reddileep which is about Leverage with Derivatives Trading using 5 Min Chart.

1. Introduce Leverage Trading in your own words.
Leverage Trading is very beneficial for traders and It can also be risky if it is done without proper strategies. This can be defined as Traders can open a position by using leverage in order to get high return from small capital.
In simple words, We can borrow multiple times amount of our own capital to open a position in the market. If It is done with proper strategies, then We can make a huge return from our small capital.
Let me explain you with an example -
Suppose I have a small capital of only $20 and as you all know that in Spot Trading, It will be difficult to make a good return from this small investment. Here comes Leverage Trading.
We can take leverage in our trading position upto 50 times or more. Suppose I have used 20x leverage on my capital. So, After taking 20x leverage on my capital, It will allow me to open a position of $400 and I can make huge return from this position if the trade will go in my desired direction.
We should do a proper research before open a position in leverage trading as If our trade goes in wrong direction, then our entire capital can be lost which is known as Liquidation.
If market appears to move upward, then we can open long position and If market looks to move downward, then we can open short position.
Leverage trading can help small traders who have small capital to make good return in short period of time as it is very beneficial if it is done with proper strategies.
2. What are the benefits of Leverage Trading?
Leverage trading is very beneficial for traders. I will discuss some benefits of Leverage Trading.
Leverage trading helps small traders who have small capital but want to make good profit. Leverage trading allows traders to take leverage on their small investment and can make huge profit
We can make profit at any time wheter it will be bull run or bear run as We can open both long position and short position as per the market condition.
We can add more fund or capital to avoid liquidation of our investment if we are in loss.
We can book Profit on our position at any time like if we are in profit, then we can easily book our profit in partial and also can close position at any time.
The best thing about Leverage Trading is that We don't need to do any calculation. We can easily see our Profit and loss on our opened position.
3. What are the disadvantages of Leverage Trading?
Apart from benefits, Leverage Trading is also risky and has some downgrades. I will discuss some of it's disadvantages here.
If Traders open any position without any proper strategies, then they can lost their whole capital.
If our trade goes in wrong direction, then our whole capital will vanish whereas In spot trading, If our trade goes in wrong direction then we can still hold our asset.
It is very risky. If we have taken high leverage, then there will be more chances of liquidation as if asset price fall even a little then we can lose our entire capital in high leverage.
There is high leverage trading fees on our positions. There is also fees on holding our position which is not in holding asset in spot trading.
- Without proper research and strategies, Traders will not be successful in leverage trading. It requires proper research and strategies before opening a position.
4. What are the Basic Indicators that we can use for Leverage Trading? (Need brief details for any essential Indicators and their purposes)
As I have already mentioned in above topics that We should have done a proper research and strategies before opening position in leverage trading. And this strategy means using of proper indicators. I will discuss some most useful indicators here.
EMA (Exponential Moving Average) Indicator
EMA Indicator is very useful as It helps trader to identify the trend in the market. It is somehow very similar to Moving Average Indicator but I prefer this indicator.
We can determine the ongoing trend with the help of this indicator and hence we can open position in that trend.
When EMA moves above the price, then there will be downtrend and we should open a short position at that time. When EMA moves below the price, then there will be uptrend at that time and we should open a long position.
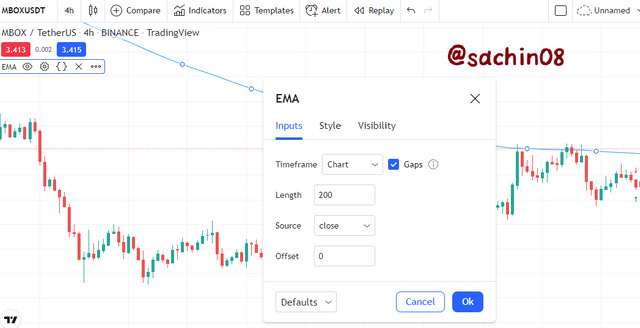
We can also customize settings of EMA Indicator. I have set the length of EMA Indicator to 200 as It is good in identifying buy/sell signals. We can also change the colour of EMA Indicator as per our choice.
RSI (Relative Strength Index) Indicator
RSI Indicator is very popular indicator for traders. It is a type of oscillator which moves between 0 and 100. It also helps traders in identifying entry points.
RSI Indicator shows Oversold region below 30 level and It shows overbought region above 70 level.
We can consider bullish behaviour or market if RSI moving from oversold region to overbought region and Similarly, We can consider bearish behaviour if RSI moving from overbought region to oversold region.
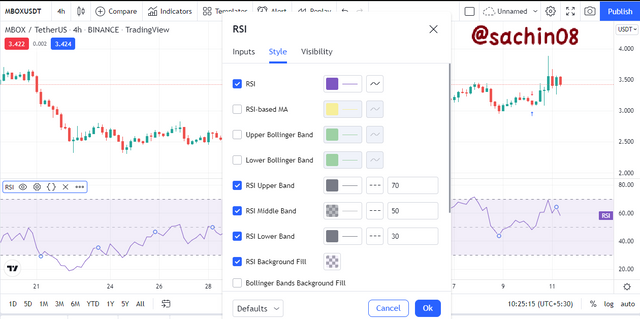
We can easily customize settings of RSI Indicator. This is updated RSI and there is option of additional indicator with RSI like Simple moving average, Bollinger Bands.
By default, SMA indicator is set with RSI Indicator. But I prefer RSI Indicator alone and hence, I removed SMA indicator from it.
Parabolic Sar Indicator
Parabolic Sar is basically a technical indicator which helps to identify the ongoing and upcoming trend in the market.
This indicator is a line of dots which also helps trader in identifying buy & sell signals.
When this indicator moves below the price, It indicates that market is in uptrend and we can open long position.
When this indicator moves above the price, then it shows that the market is in downtrend and we can open short position.
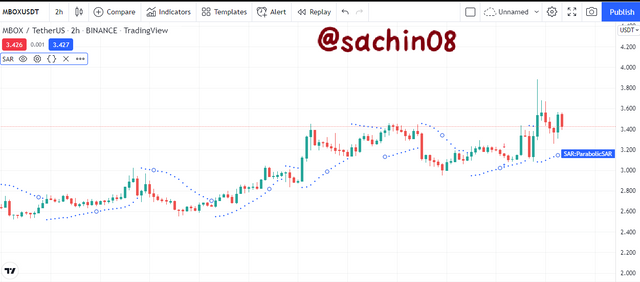
As you can see in the above image, there is Parabolic Sar Indicator on the chart. When dots are below the price, then price moves upward and when the dots comes above the price, then price moves downward.
5. How to perform Leverage Trading using special trading strategies (Trading Practice using relevant indicators and strategies, Screenshots required)
Before opening a position in leverage trading, We should do proper strategies using indicators, resistance and support levels. Here, I will discuss about proper strategies in determining buy and sell positions in leverage trading.
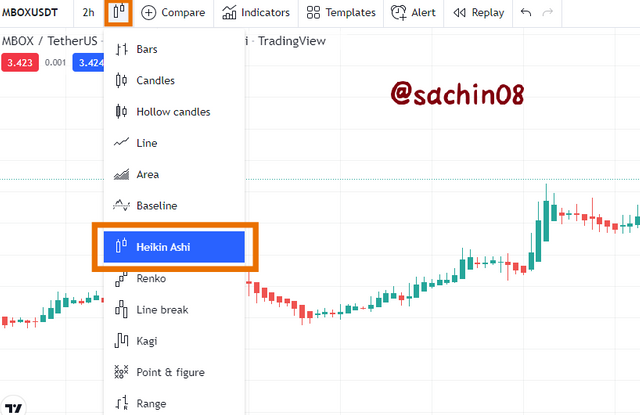
I will be performing strategies on chart of Heikin Ashi Candles in 5 minutes time frame as these candles are easy to determine the ongoing trend.
I will be using RSI Indicator and I will identify buy/sell Points from RSI value. If it goes from oversold to overbought region, then I will open long position and if it goes from overbought to oversold, then I will open short position.
I will be using EMA Indicator and Parabolic Sar to identify buy/sell points as If It goes above the price, then It will be a signal for short and If it goes below the price then it will be a signal for long. I will also use CMF Indicator for identifying entries.
Buy (long) Signal
I have used SOLUSDT chart in 5 minutes time frame. I have applied all three indicators which are EMA, Parabolic Sar and RSI.
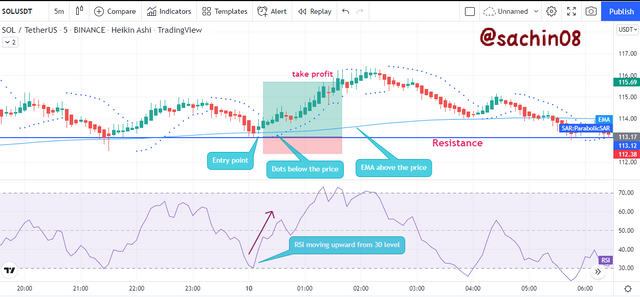
As you can see in the above image, I have marked entry point on the chart where EMA is below the price which is a sign of bullish move. For confirming, I checked Parabolic Sar and dots of Parabolic Sar are also below the price which is a sign of Bullish move.
For confirming, I checked RSI Indicator and RSI was moving upwards from 30 level which is a good sign of bullish move by the price.
So, I took an entry at that point and can open long position here at that point.
After that, You can see that I have booked my profit at marked level on the chart where I have marked take profit level as because the dots of Parabolic Sar moved above the price and Hence, I booked profit at that point.
Sell (short) Signal
Here, I am presenting an image in which I will be showing short signal using special trading strategies. I am using all three indicators which are EMA, Parabolic Sar and RSI Indicator.
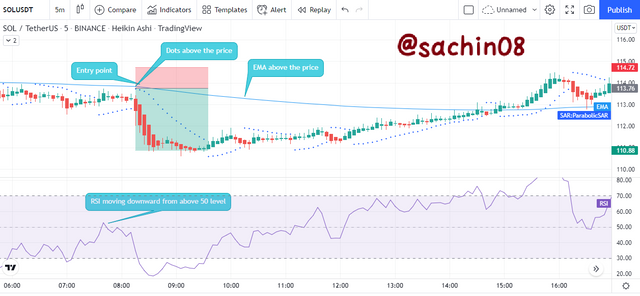
As you can see in the above image, I have marked an entry point where EMA is above the price which is a sign of bearish move.
Dots of Parabolic Sar are also above the price which is a good sign of bearish move. For confirming, I checked RSI Indicator and RSI was above 50 level and was moving in downward direction which confirms the bearish signal.
After sometime, I have booked profit in this short sell setup where the dots of Parabolic Sar comes below the price and hence, I marked take profit level at that point.
6. Do a better Technical Analysis considering the above-explained trading strategy and make a real buy long or sell short position at a suitable entry point in any desired exchange platform. Then close that buy or sell position after appearing trend reversal signal from the Parabolic SAR indicator. Here you can also close your Buy or Sell position using any other desired Trading Method in addition to the signal coming from the Parabolic SAR indicator. However, here you must prove that trading method as a reason for closing your position.
I will be using Binance exchange to perform this trade. I will be using chart of ENJUSDT in 5 minutes time frame using Heikin Ashi Candles.
I will be using special trading strategies using some indicators and will perform a real trade on Binance Platform.
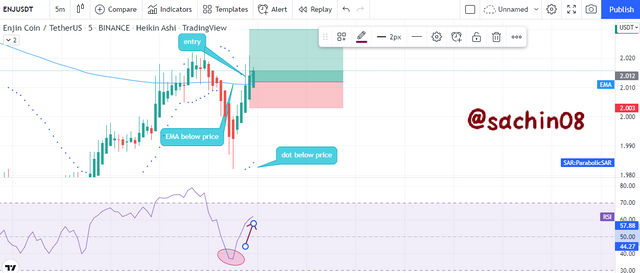
From the above image, there is chart of ENJUSDT and here, EMA Indicator is now below the price which indicates that the price can move in Upward direction.
Dots of Parabolic Sar are also started forming below the price which is a sign of bullish move by the price.
For confirming this signal, I checked RSI Indicator and It is moving in Upward direction from below 50 level which confirms the signal.
I have marked entry point here at that point and I have also mentioned all necessary things on the chart itself for better presentation.
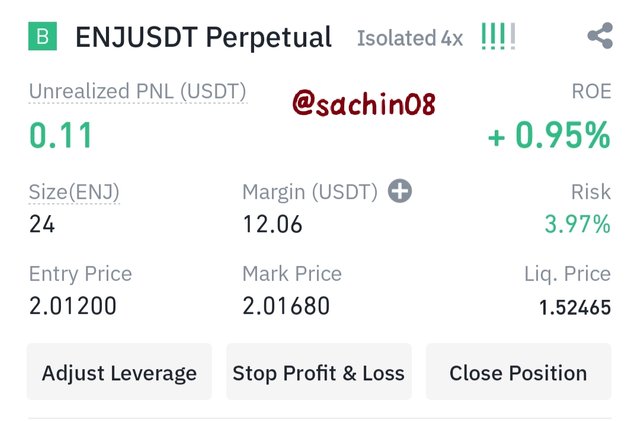
I have opened a long position at price $2.012 with 4x leverage with a capital of 12 Usdt as you can see in the below image. Liquidation will be at price $1.52465.
After opening a long position, I waited for any reversal in the price. After sometime, I noticed that dots of Parabolic sar has been appeared above the price.
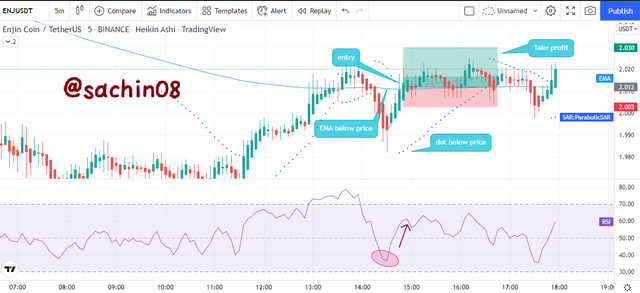
So at that point, I booked my profit and marked take profit level. I have booked a total of $0.28 profit in this trade which means It was successful trade.
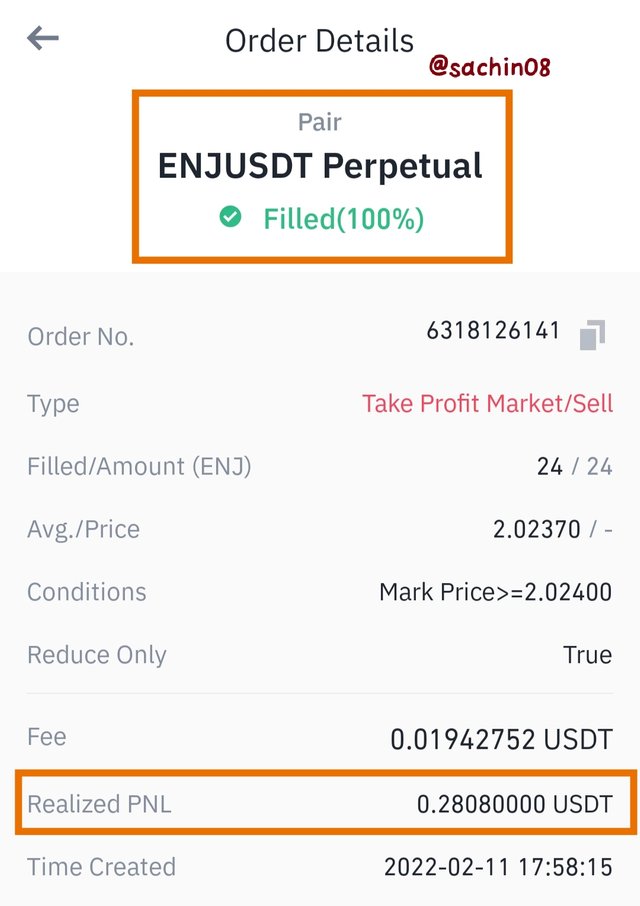
Above images shows the details of the trade I have done using special trading strategies and I booked a good profit in short period of time which indicates that our trade was successful.
Conclusion
It was a wonderful lecture about Leverage Trading. In this lecture, I have discussed about benefits as well as disadvantages of leverage trading.
Leverage trading is very beneficial for traders if it is done using proper strategies. We should always take small leverage in our traders as taking high leverage can also wipe out our whole capital.
I want to thank professor @reddileep for providing this wonderful lecture.
All screenshots are taken from TradingView and Trade screenshots are from Binance Exchange.