Crypto Trading with Average True Range (ATR) Indicator - Crypto Academy - S5W1 - Homework Post for @kouba01

Question 1: Discuss your understanding of the ATR indicator and how it is calculated? Give a clear example of calculation.
As we know that the indicators play a major role in predicting the trend direction of the market. The traders of the cryptocurrency world always try to maximize the profit they make and minimize the loss. For this, the indicators are used to check the buy and sell signals. There are many types of indicators used in trading. One of the indicator is Average True Range (ATR) indicator.
The ATR indicator is also like the other indicators but it is somewhat different from others in its major use as the other indicators are mainly used to know the direction of price but the main use of ATR indicator is to check the price volatility of any asset. Because of this, the ATR indicator is the one which falls in the category of volatility based technical analysis tool. This makes it a little different. This indicator is also used to manage risk in trading.
By the used of ATR indicator, the traders of crypto are able to set the stop loss and take profit more accurately as if any trader wants to take a good amount of profit, he/she must have a good settlement of stop loss and take profit so that any unexpected major loss can be avoided.
ATR Calculation:
The calculation of ATR starts with the determination of True range (TR). For a given period, the TR can be defined as the largest of:
- Current period high - Current period low
- Current period High - Previous Period Close
- Previous period close - Current period low
The ATR is the average of True Range over the past n number of periods. Same as any standard simple moving average, the ATR is also calculated.
The formula to calculate the current ATR is given by;
Current A.T.R. = [Previous ATR × (n-1) + Current TR]/n
Example:
Lets suppose the Current High = 30.50
The Current Low = 28.75
& Previous Close = 29.58
Also, let the Number of periods (n) = 14
We have to find the True range (TR) and Average true range (ATR).
To find the TR, substitute the supposes values in the relation,
TR = max from (Current period High - Current period low, Current period High - Previous period Close, Current period low- Previous period close)
TR = Max (30.50-28.75, 30.50-29.58, 28.75 - 29.58)
TR = max from (1.75, 0.92, -0.83)
The max value is 1.75. So TR is 1.75.
Now,
For Current ATR, lets suppose the previous ATR be 2.25.
I have already calculated Current TR which is 1.75.
To calculate ATR, put the values in the relation given above,
Current ATR = [(2.25 * (14 - 1) + 1.75)] / 14
Current ATR = [(2.25 * 13 + 1.75)]/14
Current ATR = 31/14
Current ATR = 2.214
Thus, the Current ATR is 2.214.
Question 2- What do you think is the best setting of the ATR indicator period?
As, the question wants the best ATR indicator settings according to me, so I have mentioned the settings according to my comfort level. The setttings vary from trader to trader and every trader has its own setting according to his/her trading plan.
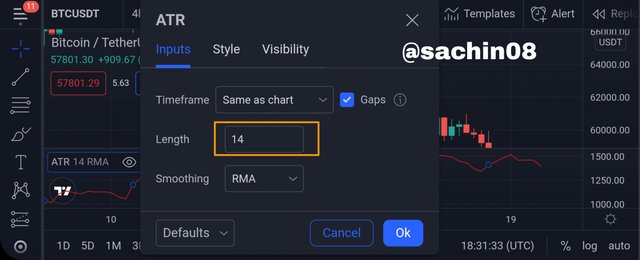
Now, lets come to the period of ATR indicator. By default the period of ATR indicator is set at 14 which is standard setting but we can also change the period number in the settings of the indicator. The default set of 14 period means that the indicator will measure the volatility of price of asset for the last 14 period. The periods can be increased or decreased according to the user.
If the period numbers are increased more than 14, it will show results more accurately we get a smooth range. Also the signals of the indicator remains same throughout for a longer time period. But when there are small fluctuations in price, then it will not be shown in the chart. On the other hand, if the periods are low in number, then the results produce are more inaccurate but the signals are also given at any minor price fluctuation.
Now, if the trader is doing trades for short term period, then he/she must take small period setting of around 8 to 10 periods. It is helpful in short term high profit gaining and reducing risks of lossing money. If the traders are doing trades for long term, then they should take high period setting i.e. of around 50 periods.
Trading by ATR indicator in this strategy will make good profit and will insure low risks. Different traders have different strategies and so they can change the period according to them.
Question 3: How to read the ATR indicator? And is it better to read it alone or with other tools? If so, show the importance. (Screenshot required)
The ATR indicator is easy to use and understand. It is not so difficult like other indicators. The ATR indicator makes its spikes according to how volatile the market is. We can say that it is a repeated cycle where the price always go back to the low volatility area. The area of high volatility is marked in the chart of BTCUSD below.
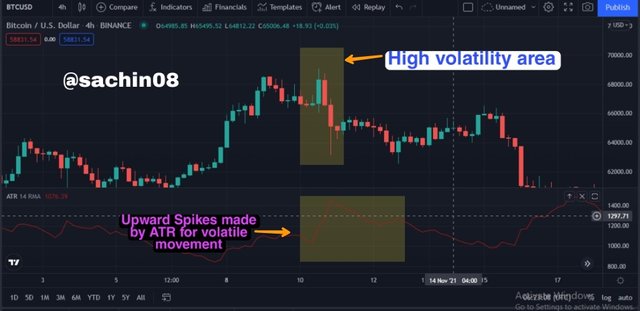
In the above chart, we can see that the ATR indicator has made an upward spike which is formed according to the bearish volatile price movement. After every upward spike the ATR indicator shows a back retracement to a movement of low volatility and this movement repetition is likely to happen.
Combination of ATR and Bollinger bands:
When a trader wants to identify rhe entry and exit points of the trade and when he/she wants to set a risk management procedure in trading, the ATR indicator proves to be a good indicator. But when the trader needs to see the momentum or direction of the trend, it is hard to use the ATR indicator.
Thus, if you want to get better results which are not given by ATR indicator alone, it is ideal to combine the ATR indicator with any other indicator. The merging of two indicators will give better results. I have merged the bollinger bands indicator with ATR indicator which is shown in the screenshot below.
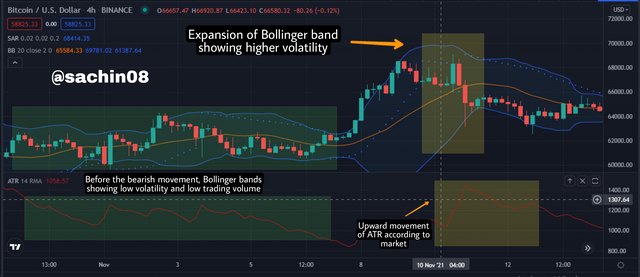
In the above combination of ATR indicator and Bollinger bands indicator, we can see that the bollinger band has increased its size to confirm the area of high volatility in the quick increament of trading volume of the coin. In Parallel, the ATR indicator has also made an upward spike for the confirmation of volatility.
Before the area of high volatility, the bollinger bands has confirmed the area of low volatility in the chart. The similar volatility is also indicated by the ATR indicator as it is decreased its spike.
So, we can say by seeing the above charts that it is favorable and beneficial to use the combination of ATR with any other indicator such as Bollinger bands and CCI as better results are provided by it.
Question 4: How to know the price volatility and how one can determine the dominant price force using the ATR indicator? (Screenshot required)
When the traders buy any asset in lare amount and sell it in short term, a quick upward and downward movement is created which is seen in the charts. The correlation of ATR with the price impulse is used to determine the potential volatility of the market.
When there are quick impulse movements in the market then they are depicted by the indicator. By this, we can understand that the large candlesticks signify high volatility of the market and ATR indicator always responds to those large candlesticks. The illustration of the ATR indicator in the chart of BTCUSD is shown below.
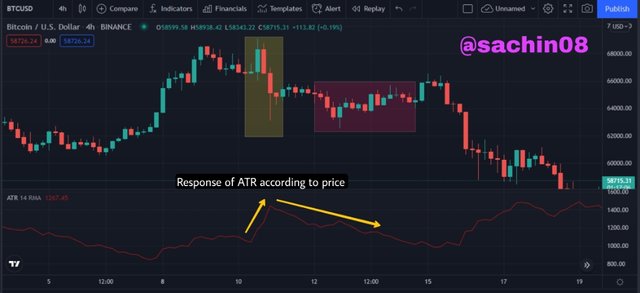
In the chart above, we can see that the price of asset has taken a quick bearish impulse and long bearish candels were made which shows that the asset has sold in large amount in a short time period. In order with the price movement, the ATR indicator also took an upper spike or upward movement.
After the long bearish movement and quick volatility increase, the price started go down sidways and this also shown by the ATR indicator as it has also reduced its value and started to decrease in downward direction.
Determining the dominant price force using ATR indicator
When the ATR indicator increase its value according to the bearish or bullish movement of price, then the dominant price force is determined. It means that the dominant price movement is identified by the ATR indicator. The chart given below of BTCUSD has shown the bearish movement of price.
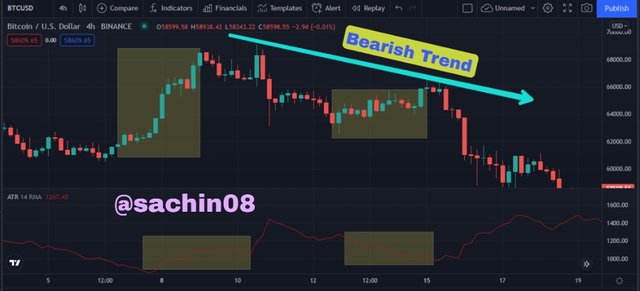
The areas of bullish move are marked in yellow and we can see that there is not much movement shown in ATR. This means that the force which drives the price increase is not enough.
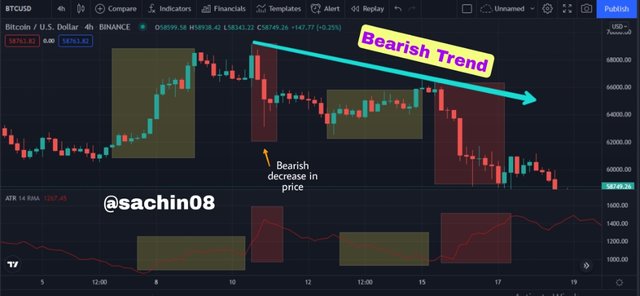
Now in the next image give above the areas which are marked red shows a major bearish price decrease and we can see that the ATR indicator has also identified this and it has made an upward movement in both areas. So it is verified that the dominancy short term sellers is there.
Question 5: How to use the ATR indicator to manage business risk? (Screenshot required)
The risk is very important factor in the life of every trader. The risk can be managed in two ways in which the first way is the use of ATR to place stop loss and second is the use of ATR to place take profit.
Placing stoploss:
The stop loss is very important for every trader. Many of thr traders ignore to place stop loss. But is is necessary to place it because it helps the trader to limit the amount of loss if the trade goes against the prediction.
As the market is of 24 hours and no one can check the trading all time. For that reason, the stop loss is placed any time when we open a trade and it is recommended to determine it before placing the trade. By the use of ATR Indicator, we can set stop loss. To do that, an example of my trade is given below.
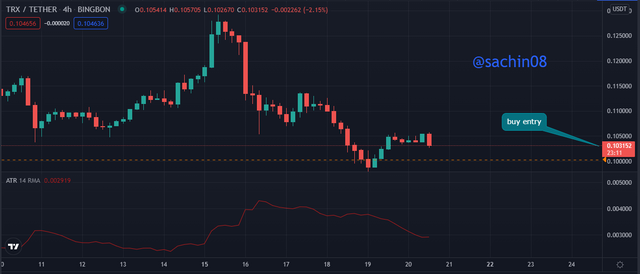
From the above chart, I want to take a buy entry at the price 0.103152 and I have set the ATR value of around 0.003000.
Now, we can set the value of stop loss which can be taken as 1 times of ATR, 2 times of ATR or 3 times of ATR. I have taken the level of stop loss at 2 times of ATR which is equal to 2×0.00300 = 0.00600.
So, Stop loss price = Entry price - Level of stoploss
Stop loss = 0.103152 - 0.00600
Stop loss price = 0.097152.
Placing take profit:
As like placing of stop loss, the take profit setup is also very important factor for trader to manage the trading risk. By setting take profit at the desired price, the position is closed and profit achieved as in same case as of stop loss, we cannot check the trade all time. So placing take profit is necessary as if we do not place it, then the price after reaching the desired range may come down and you will miss your profit.
Now, I am using ATR indicator for take profit Placement.
I have taken entry at 0.103152 and taken the take profit level of 3 times of ATR i.e. 3×0.00300 = 0.00900.
So, Take profit price = Entry price + Take profit level
Take profit price = 0.103152 + 0.00900
Take profit = 0.112152.
Question 6: How does this indicator allow us to highlight the strength of a trend and identify any signs of change in the trend itself? (Screenshot required)
Use of ATR Indicator in Highlighting Strength of trend
As we have already seen above that rhe ATR indicator is used to determine the dominant price force of any asset and thus it can also be used to determine the strength of trends. But it does not determine the direction of trends in the terms of trend strength.
In most cases, the bouncing back of the prices is done from resistance level which is broken so that a new trend can form and greater momentum can be achieved. The price of the market can go in upward or in downward direction according to the action of buying and selling of traders. The refection of price is shown in the chart given below.
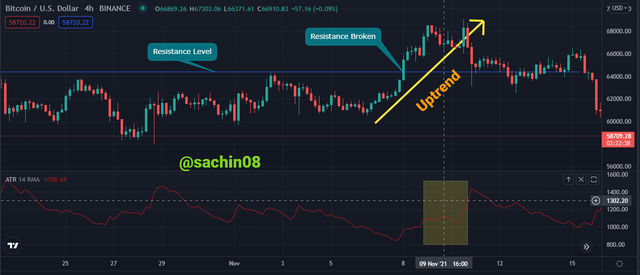
In the above chart we can see that the resistance level which is shown by blue line is broken by the price of asset and it creates an indication of having uptrend. This verifies that during this period, the buyers of asset have a strong dominant force to push the price which leads to the formation of spike in ATR movement.
Use of ATR in Highlighting Signs of Trend Reversal
For checking the dominant force, the ATR is used. It is also noted that the increase of ATR indicator is with the movement of price. At the time of exhausting of dominant force in market, the movement of ATR starts decreasing with time and with this, the price of asset also starts to decrease.
Thus there forms an initiation of trend reversal which is formed due to lack of dominant force to push the asset in continue direction and the direction gets reversed.
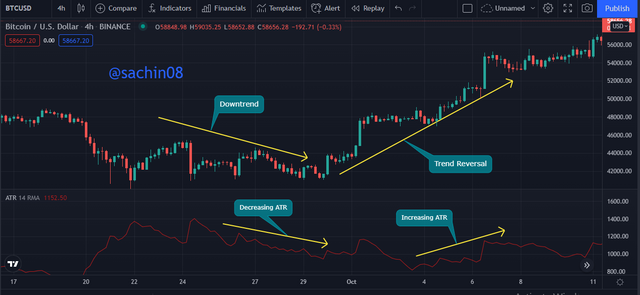
From the above given chart, we can see that at the time of completion of bearish trend, there is also seen a decrement on ATR value. Then, a small momentum is gathered for the formation of new trend. The price breaks above the resistance level and with this, the ATR value started increasing. With the continuation of price increase, the ATR value has also continued going up.
Question 7: List the advantages and disadvantages of this indicator.
Advantages of ATR indicator:
The ATR indicator is not much difficult to understand like as the other indicators. Only by looking the indicator, we can find the meaning of its formation.
The ATR indicator is easy to undertand and so it helps to traders to set correct stop loss and take profit level to take proper decision and manage risk.
According to the suitability of the trading plan of trader, this indicator can accommodate any sort of trading strategy and at any time frame.
When the ATR indicator is used in combination with the other indicators such as SAR and RSI, the efficiency of the indicator gets increased.
Disadvantages of ATR indicator:
By the ATR indicator the traders can not predict the future trend of the market.
The volatility signal is given by the ATR indicator but there is not any exact value given in order to measure the volatility.
There is not 100 percent accuracy in this indicator. Many times, it does not show correct signals which results in loss of assets.
If there is any small correction or fluctuation in the price of any coin, then there is no spike form on the ATR indicator.
CONCLUSION
The ATR indicator is easy to use in comparison to other indicators. This indicator is mainly used in checking the volatility of price of any asset. It was great for me to get knowledge about this indicator from the lecture of professor. The indicator has provided me much benefit and I have learnt to use it in different ways such as combining it with other indicators.
The lecture of professor @kouba01 has proven beneficial for me and I am thankful to him for makeing this great lecture.
Hello @sachin08,
Thank you for participating in the 1st Week Crypto Course in its 5th season and for your efforts to complete the suggested tasks, you deserve a Total|7.5/10 rating, according to the following scale:
My review :
Good work in general in which the answers differed in their analysis and interpretation, and these are some notes.
A good interpretation of the ATR indicator, it was possible to rely on a graph to confirm the results obtained in calculating the value of the indicator at the instant t.
It would have been possible to go in more depth to explain the difference between an increase or decrease in the value of a period and to have clearly stated your personal choice.
Your answer to the third question was good.
You did not deepen your analyzes for highlighting the strength of a trend and identifing any signs of change.
Thanks again for your effort, and we look forward to reading your next work.
Sincerely,@kouba01