Crypto Academy / Season 3 / Week 7 / [@Homework Post for @yousafharoonkhan] / Trading View

(1)Defining the TradingView site and how to register an account in tradingview? what are the different registration plan?
Trading View is an app or a website through which We can get access to all the trading charts whether they are crypto charts, stock charts, forex or gold.
We can do analysis by charts on trading view. Charts is an very important prospective for mailing profits in trading. As There are different different strategies in trading which can only be done through charts and We can get all the charts of all types of trading on Trading View Application.
We can get all time zones charts like 1min, 3 min, 15min, 1 hour, 4 hour, 1 day and many more. We can easily edit thr charts in our own way.
Most of the expert traders first do analysis on charts using Trading View Application and then do trade. Analysis of Charts through Trading View app is now the most important criteria in trading.
How to Register an account in Trading View?
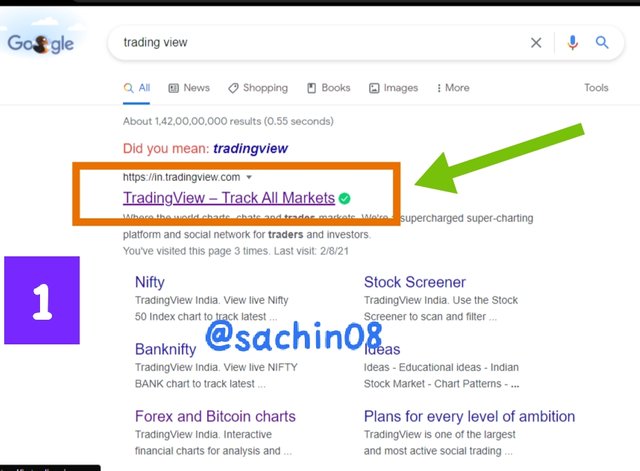
First of all, Go to Google and Search Trading View and Click on the first option that appears by searching it.
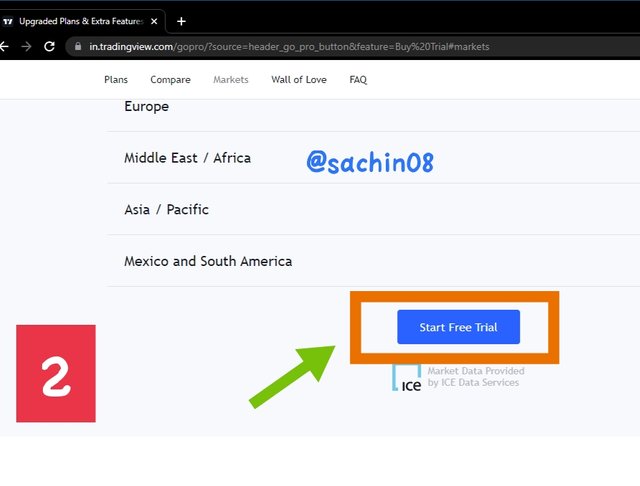
After Clicking on it, An interface will open and then scroll down and click on Start Free Trial.
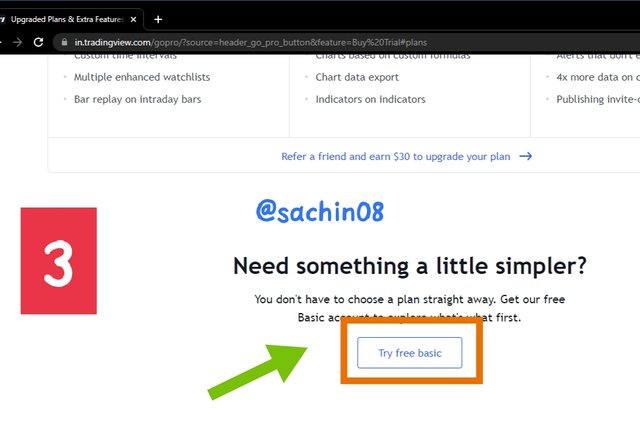
After that, Scroll down and click on Try Free Basic.
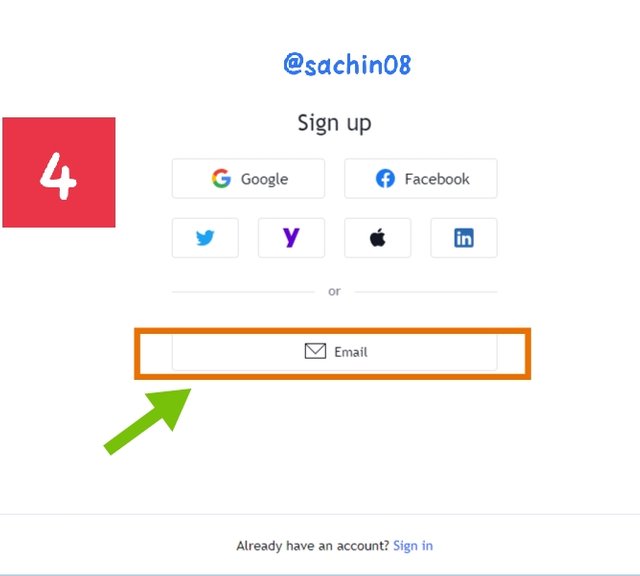
After that, An interface will open and then it will ask you to sign up using many options like Google, Twitter, Facebook, Email and many more. I chose Email here to signup on Trading View. So, I click on e-mail.
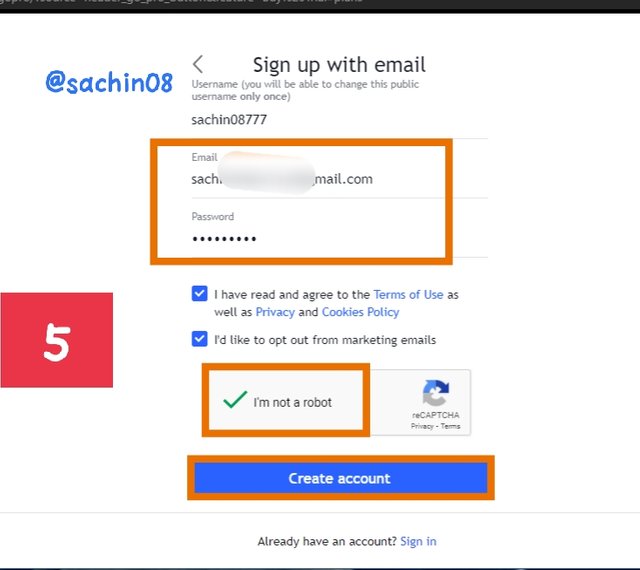
After clicking on Email, Put your Username, your email and password and verify the Captcha and then, Click on Create Account.
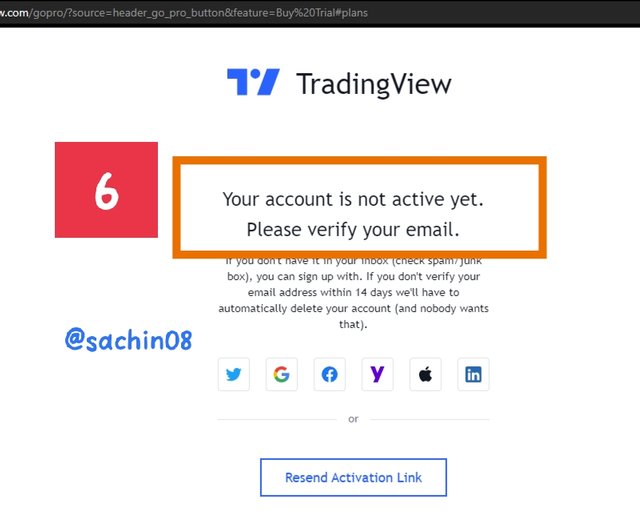
Then, It will ask you to verify your email. It will send an activation link to your registered email. So, Check your email for activation link.
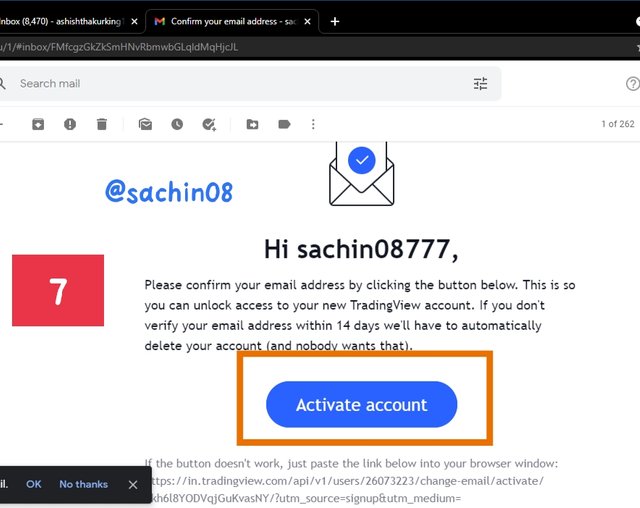
Open your email and Click on Activate Account.
Then Put your First name and Last name and Profile Picture and Click on Continue.
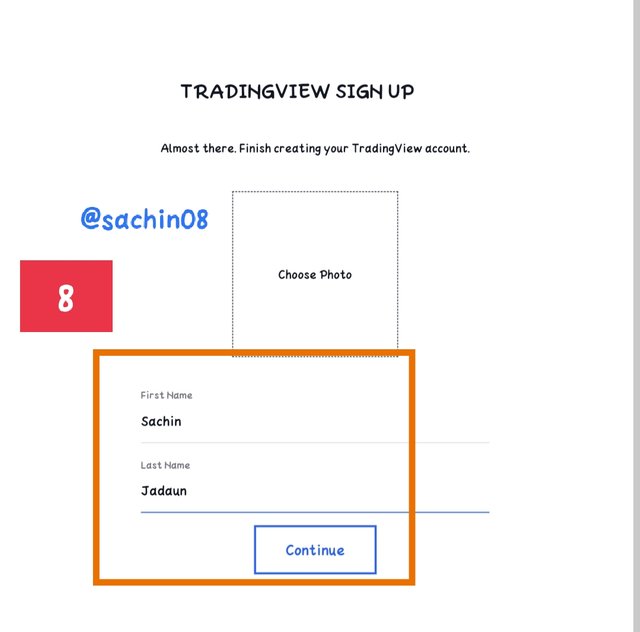
Yay! Your Account has been successfully registered on Trading View.
Different Registration Plans
If you want to buy plan in Trading View, then there is different plans. There are three plans which are Pro, Pro+ and Premium. Let me tell you monthly plans.
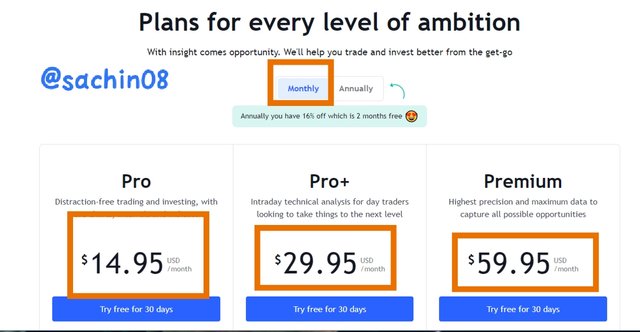
You can see these 3 plans and their cost in above image.
Monthly Pro Plan - $14.95
Monthly Pro+ Plan - $29.95
Monthly Premium Plan - $59.95
Now, Let me tell you annual plans as you can save 2 months fees in annual plan.
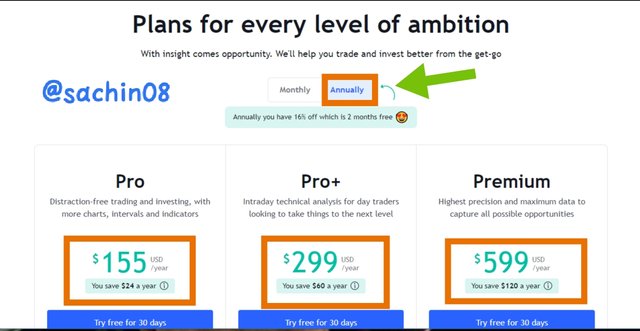
Annual Pro Plan - $155
Annual Pro+ Plan - $299
Annual Premium Plan - $599
(2) Explain the different features of tradingView and what is your favorite feature and why?
Now, Let's explore the features of tradingView. The first feature that is very important is Market Feature.
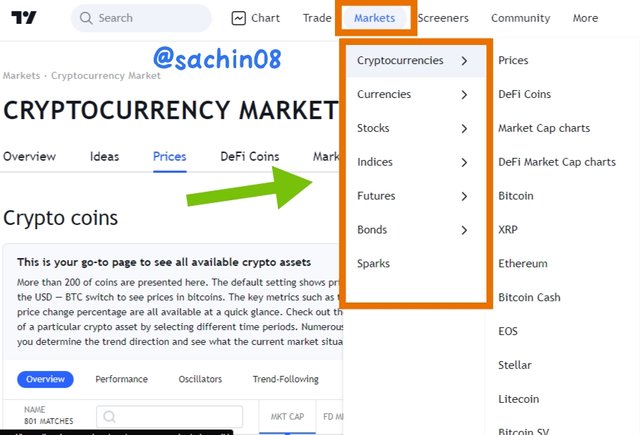
The best thing about this market feature is that It has all stocks, crypto, Currencies, Futures and many more. We can explore all currencies of crypto, stocks through this feature.
We can get all the valuable information and current information in the market of any crypto assets or stock market assets through this feature.
When We click on market, There appears some options like Cryptocurrencies, Currencies, Stocks, Futures and many more. So, We can checkout all the information of all these currencies through this.
Let's explore about XRP in cryptocurrencies. So, I clicked on Market, then Cryptocurrencies, then XRP.
Here comes the information of XRP-
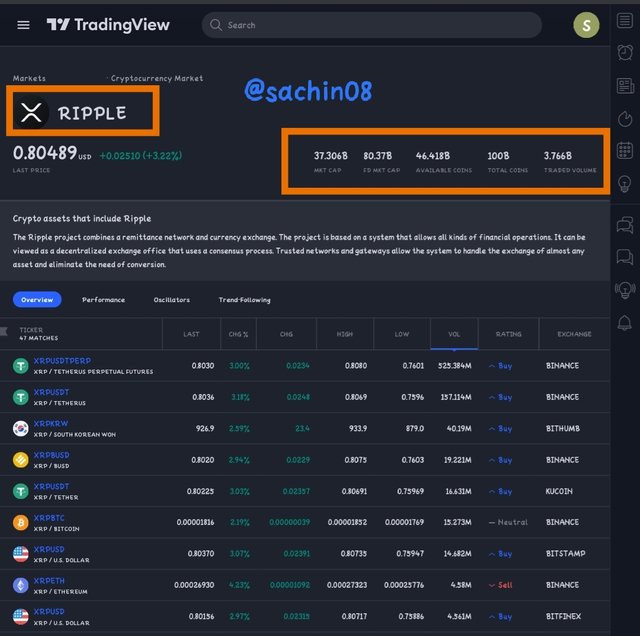
There appears all the necessary and valuable information about XRP like It's other name, Market Cap, Last Price, Circulation Supply, Traded Volume and Its pairs in all the Exchanges as you can see in the above image.
Now, Let's talk about other feature which is Screening.
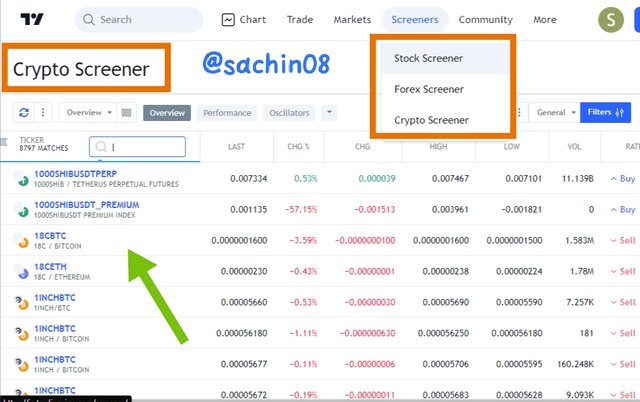
After clicking on Screening, You will see three options which are Stock Screener, Crypto Screener and Forex Screener.
Through Screening Features, We can check all the latest activities like sudden change, last hour Volume about particular assets.
You can see in the above image that I have opened Crypto Screening and it shows the change in %, high, low and volume of crypto assets.
In Trade Feature, We can check Top Brokers and their particular Broker Awards. Brokers are generally involved in Stock Market.
In Community Feature, We can check ideas and thoughts of our followed authors, idea related to cryptocurrencies, stocks.
What is Your Favorite Feature and Why?
My Favourite feature is the market feature as We can get all the valuable and important information about a particular assets within second.
It contains all information whether we want to get stock, crypto or forex information. I usually search particular crypto asset information as it is easier to get current or last hour information in one click.
(3) How to set up a chart in TradingView and use two tools to edit it.
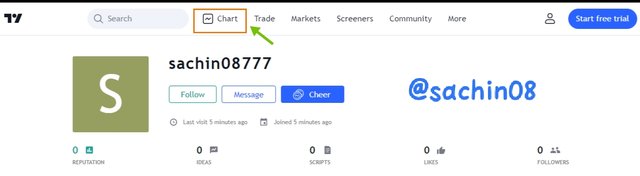
First of all, Click on Charts which is in upper left corner.
Then, Select a pair. I have selected BTCUSDT pair.
Now, Let's talk us about the charts section.
.png) BTCUSD Chart
BTCUSD Chart
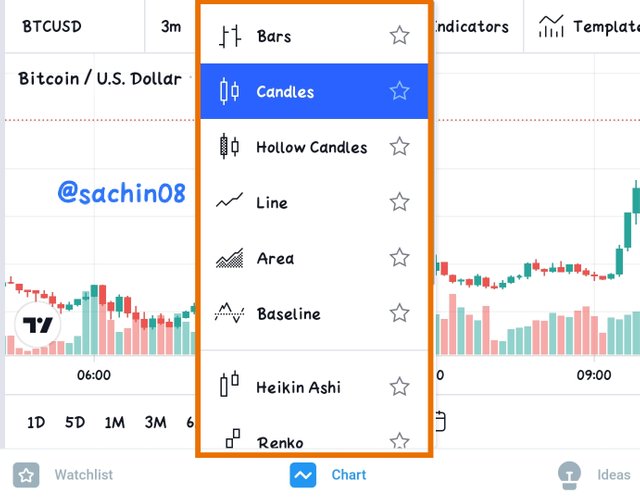
We can set the candle style as per our choice. There are many styles like Candles, Hollow Candles, Line, Bars and many more.
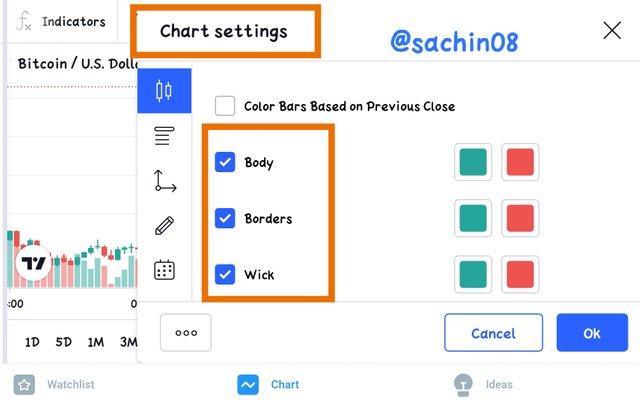
We can also set the Chart settings as per our choice like body colors, wick, borders etc.
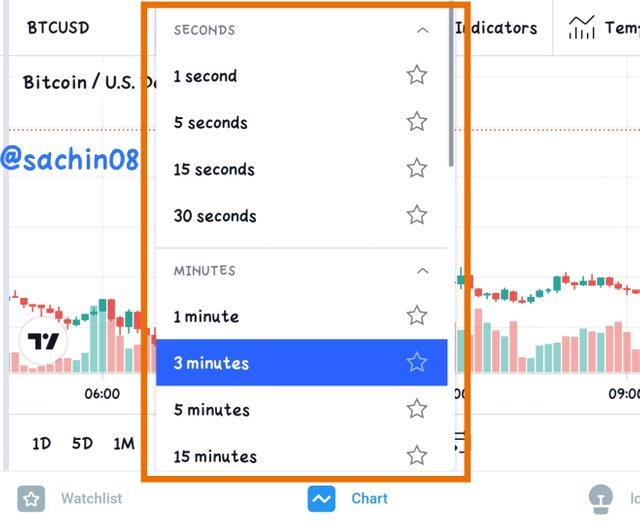
We can set the time frame which we want to get like 1 minute, 3 minutes, 1 hour, 4 hours, 1 day and more.
This is all about how we can setup our chart.
Now, Let's talk about some tools so which we can edit our charts. I will talk our two tools and use them.
(A) Firstly, I will talk about Trend Line tool. Click on Geometric Shapes.
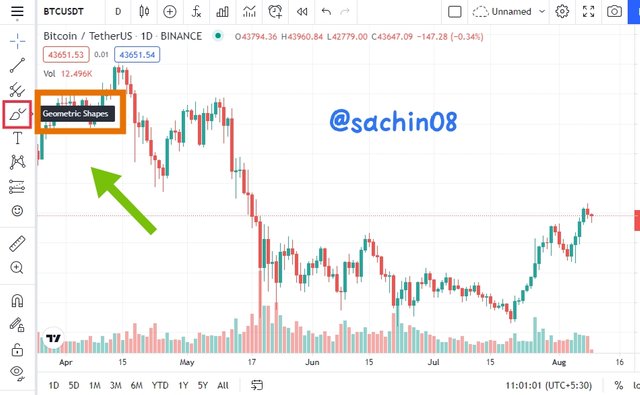
• Then, Click on Trend Line
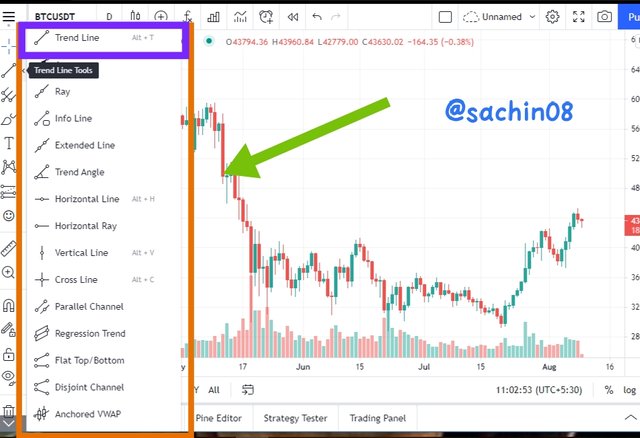
• After that, You can set Trend line in the chart according to your analysis. You can see in the below image how I have put trend line in the chart.
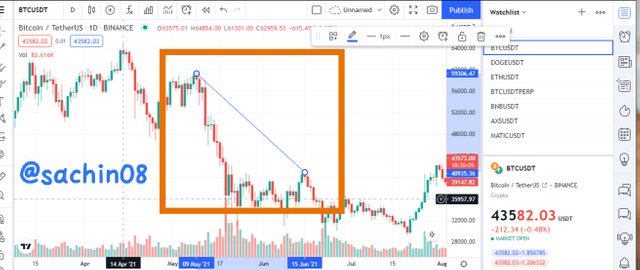
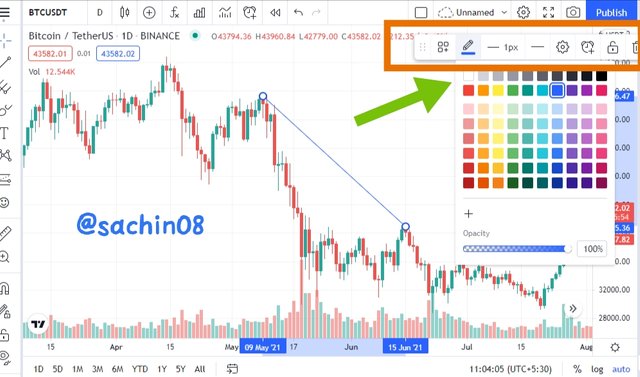
• We can also change the colour of our trend line and We can also set the width of the trend line in pixels.
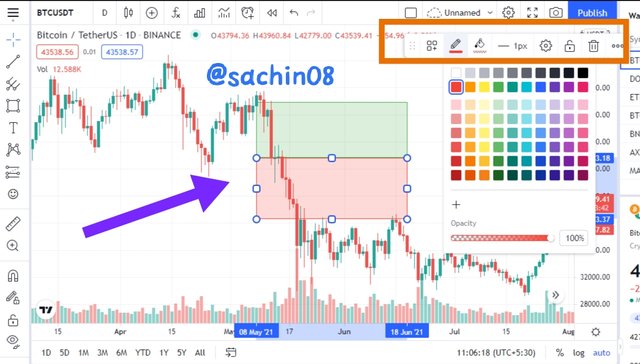
(B) Now, I will talk about Rectangle tool which is very important in trading charts.
• Click on brush section and then Select Rectangle Shape.
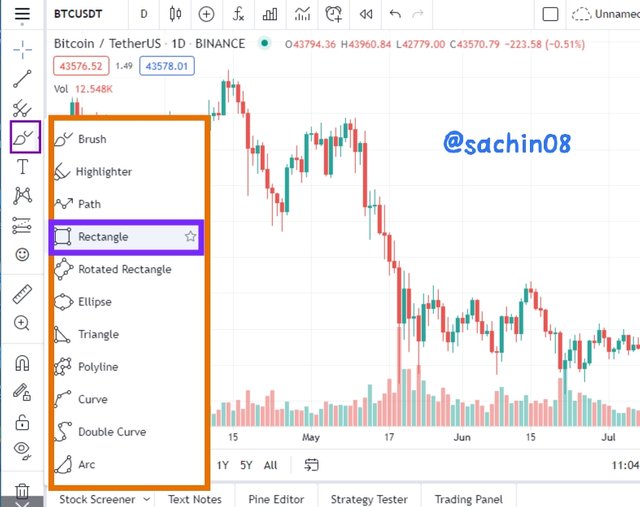
• Then, We can adjust our rectangles according to chart analysis as in the image below. We can also set the border color, color of rectangle and width.
(4)Explain how to add indicator in chart, what is your your favorite indicator and why?
Indicators is the most important tool used to predict the market trend.
Click on Fx(Indicator & Strategies) which is on upper side.
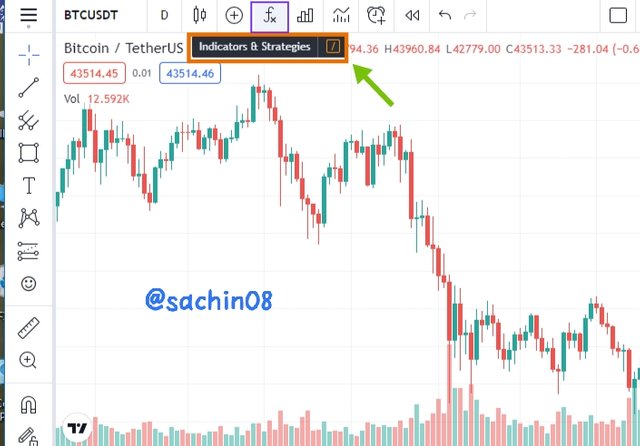
And then Search Indicator.
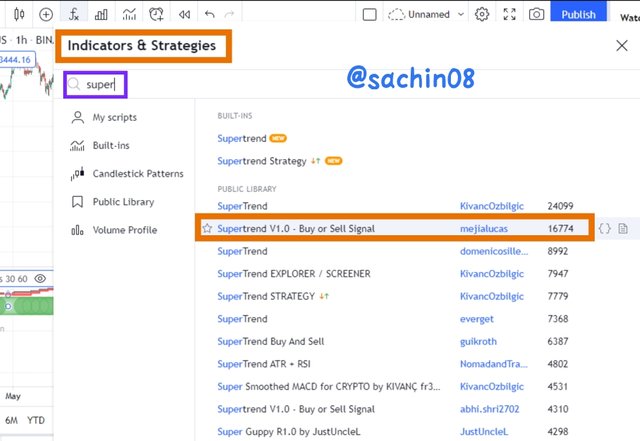
There are lots in indicators. My favourite indicator is Super Trend Indicator. Search Super Trend Indicator and then Click on Marked Indicator.
Let me tell you more about Super Trend Indicator.
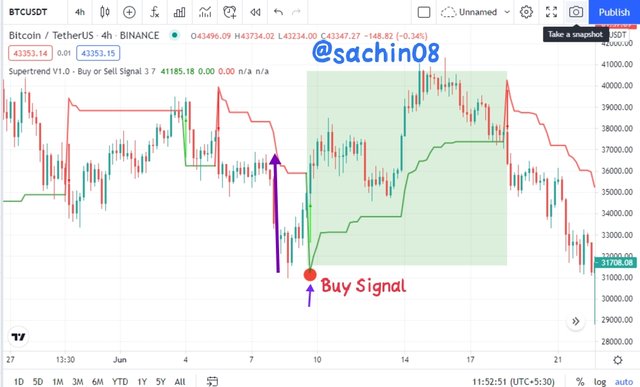
After Clicking On Super Trend Indicator, There appears green line and red line on thr charts of assets and It will show the bullish and bearish trend.
You can see in the below image how bullish trend is identified through this Super Trend Indicator and how can we book profit.
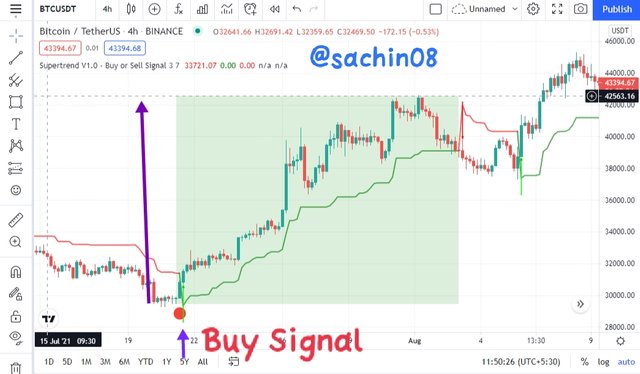
When Green line starts on the chart, then it will be the buy signal. And When this green line becomes straight then We can sell our holdings or book profit.
You can see in this above image how this indicator gave bullish signal and when this line becomes green.
We can check this in any time frame but I will recommend to use in minimum 4 hour time frame as it will be benificial.
Let's take an another example.
You can see in the above image, When the line becomes green in the Chart, It shows bullish trend and when the green line becomes straight then it's the time to sell holdings or book the profit.
(5)Do you think TradingView is useful in predicting the market for cryptocurrency (trend / price)?
I think Trading View is the most important application in crypto trading. We can check all the charts of every crypto currency in any time frame.
Trading View is very very helpful in predicting the market trend. As Indicators Feature in Trading View Application helps much in predicting the market trend.
There are many strategies like Break-Retest-Break (BRB) Strategy, Market Structure Break (MSB) Strategy which are very helpful in predicting the market trend and these strategies can only be done through using Trading View.
We can also easily setup our charts using Trading View itself. It has in-built tools which helps in set up of charts like Trend Line, Rectangle, Brush, Text etc.
Nowadays, Almost All Traders use tradingView for predicting the market trend and I am also using TradingView since few days and It is really helpful in predicting market trend.
Conclusion
Thank you professor @yousafharoonkhan for providing this much informative lecture.
Trading View is very helpful and useful application in Trading as It helps traders for predicting the market trend to be bullish or bearish.
The two strategies (BRB & MSB) which I have mentioned above, I have learned these both from prof. @cryptokraze and the important thing is We can use these strategies only through tradingView. Most of the advanced lectures of @cryptokraze prof. are related to tradingView.
Respected first thank you very much for taking interest in SteemitCryptoAcademy
Season 3 | intermediate course class week 7
thank you very much for taking interest in this class
Thanks a lot professor for giving valuable feedback.